


Microsoft (MSFT) Stock Hits a 4.5-Month High
FXOpen

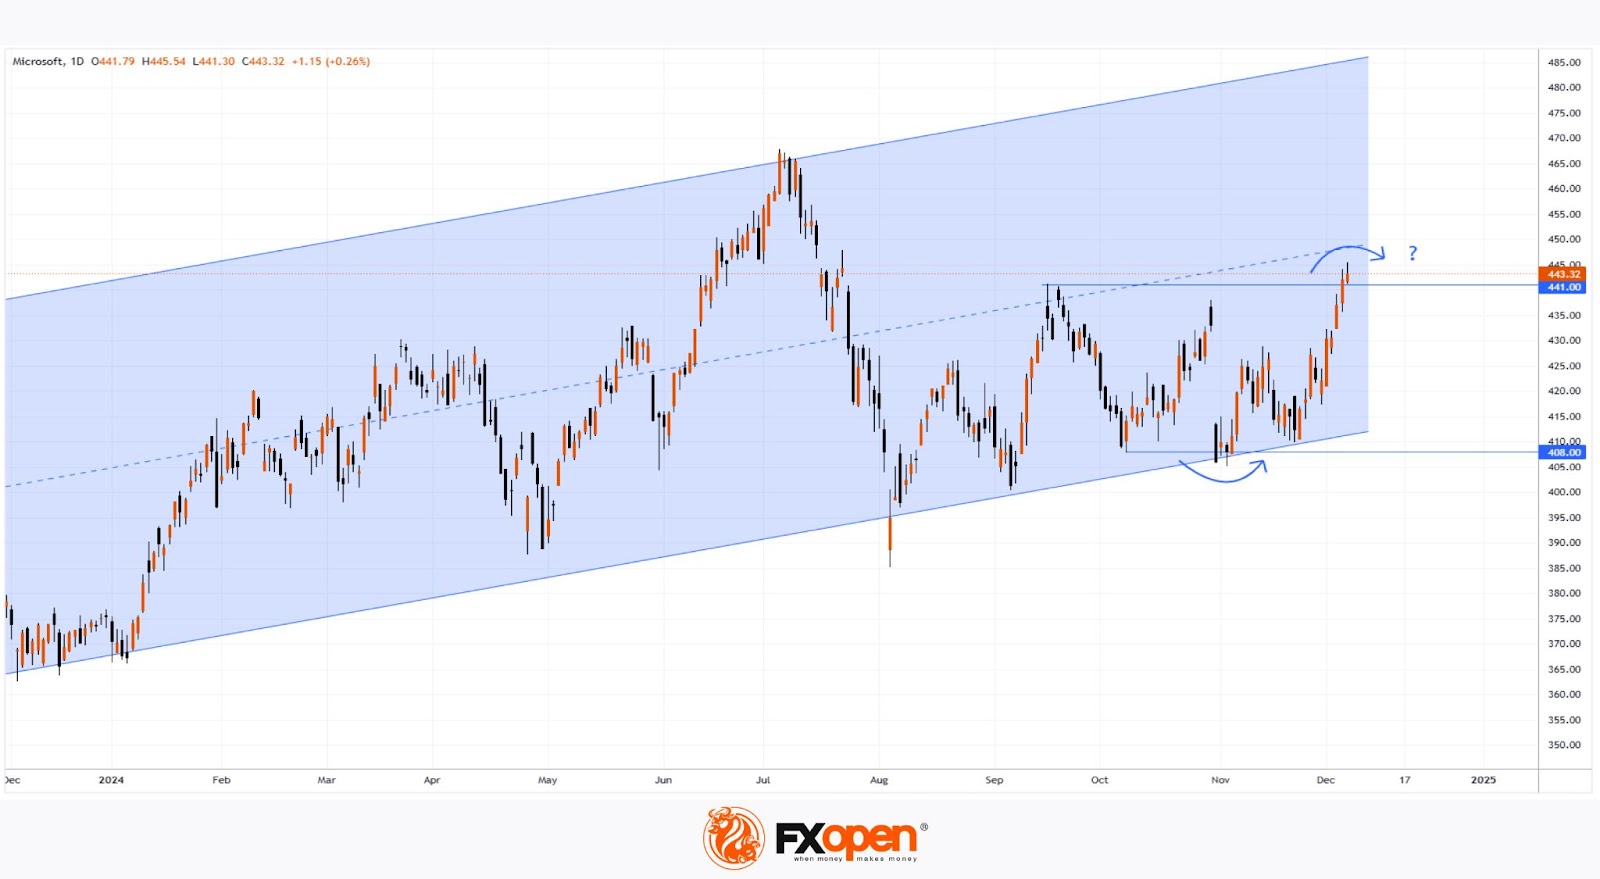
On 31 October, our analysis of Microsoft (MSFT) stock highlighted:
→ The price is forming a long-term upward channel, illustrated in blue.
→ The channel’s lower boundary serves as a significant support level.
On Friday, MSFT stock climbed to $445, its highest level since mid-July, buoyed by news that OpenAI may grant Microsoft access to key AI-related technologies.
Will the Price Continue to Rise?
There are reasons to suspect that the bullish momentum may not sustain.
Technical analysis of MSFT’s chart today suggests:
→ The price is near the median of the long-term channel, and this median could act as resistance. This is hinted at by the long upper shadows on Thursday and Friday’s candles.
→ The emerging bullish breakout above the September high around $441 might prove to be a false breakout, similar to the false bearish breakout of early October support near $408 (highlighted with arrows).
Additionally, Microsoft’s stock has underperformed compared to market indices, which are at historic highs. This could mean the price may retrace to $430 or lower, aligning more closely with average autumn levels.
Analysts, however, remain optimistic about MSFT’s prospects. According to TipRanks:
→ 26 out of 29 analysts recommend buying MSFT stock.
→ The average 12-month price target for MSFT is $497.
Buy and sell stocks of the world's biggest publicly-listed companies with CFDs on FXOpen’s trading platform. Open your FXOpen account now or learn more about trading share CFDs with FXOpen.
This article represents the opinion of the Companies operating under the FXOpen brand only. It is not to be construed as an offer, solicitation, or recommendation with respect to products and services provided by the Companies operating under the FXOpen brand, nor is it to be considered financial advice.
Stay ahead of the market!
Subscribe now to our mailing list and receive the latest market news and insights delivered directly to your inbox.


Latest articles

Natural Gas: key support amid renewed escalation
A key development on 13 April was the start of a naval blockade of Iranian ports, a direct consequence of the collapse of negotiations in Islamabad on 12 April. The blockade covers all vessels entering and leaving Iranian ports in

European Currencies Advance Amid Shifting Geopolitical Outlook
The initial rise in EUR/USD and GBP/USD was driven by reports of a temporary ceasefire between the United States and Iran, which reduced demand for the US dollar as a safe-haven asset. However, over the weekend, reports emerged

Market Analysis: GBP/USD Holds Firm, USD/CAD Bulls Target Breakout Move
GBP/USD started a downside correction from 1.3480. USD/CAD is gaining bullish momentum and might clear 1.3880 for more upside.
Important Takeaways for GBP/USD and USD/CAD Analysis Today
· The British Pound rallied toward 1.3500