


FXOpen

Morgan Stanley (MS) reported its third-quarter results:
→ Earnings per share: actual = $1.88, forecast = $1.59
→ Gross revenue: actual = $15.38 billion, forecast = $14.35 billion
According to Barron’s, Morgan Stanley’s profit increased by 32% compared to last year, driven by heightened activity in investment banking, which had previously been pressured by the Federal Reserve's high interest rates.
Market participants reacted positively to Morgan Stanley’s success, with MS shares rising 6.45% in a day, reaching an all-time high. Will the rally continue?
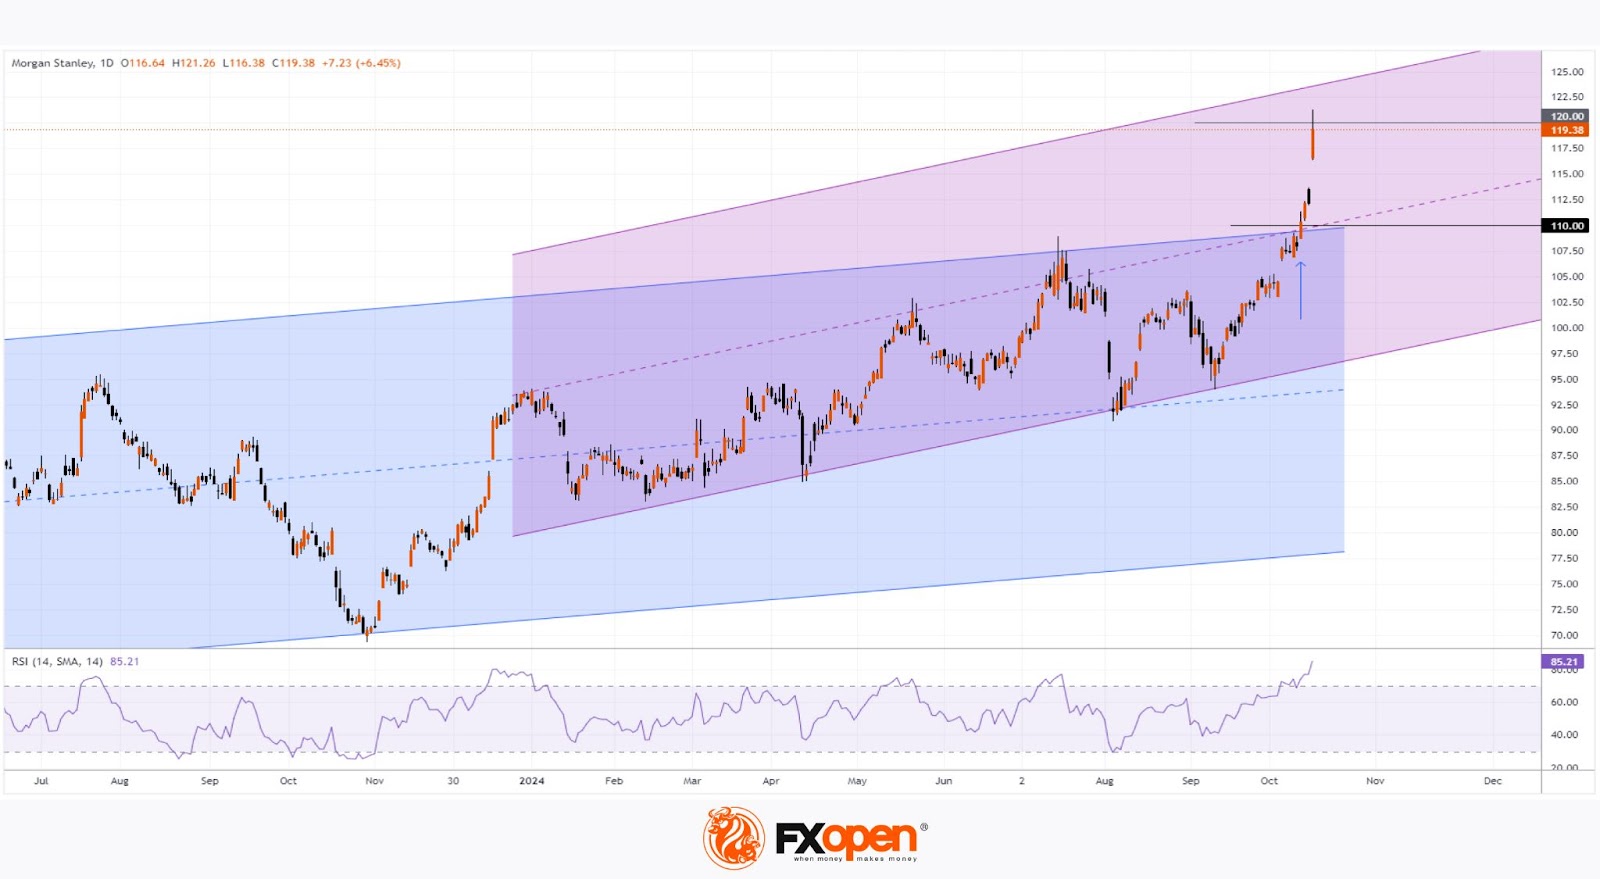
A technical analysis of the daily MS stock chart indicates:
→ The price action has formed a long-term channel (shown in blue), and in October, the price broke through its upper boundary. A strong price movement (indicated by an arrow) occurred at this resistance level around $110, influenced by strong reports from other banks. Bulls demonstrated dominance here, and this level may now serve as support.
→ In 2024, a steeper price growth trend is observed, providing anchor points for constructing an upward channel, shown in purple. Today, the MS stock price is positioned in the upper half of this channel, nearing its upper limit.
→ The RSI indicator is at its highest since January 2020.
→ Yesterday's candle closed well below the highs, with the price unable to hold above the psychological level of $120.
Given these factors, it is reasonable to suggest that the MS stock price is vulnerable to a correction as the initial reaction to the strong report may wane. If a correction occurs, it’s possible the price may retreat to the $110 level, where two channel lines converge, potentially providing support.
Analysts’ forecasts also indicate a likelihood of a pullback. According to TipRanks, the average price target for MS shares is $112 over the next 12 months, with 4 out of 12 analysts recommending buying Morgan Stanley (MS) shares.
Buy and sell stocks of the world's biggest publicly-listed companies with CFDs on FXOpen’s trading platform. Open your FXOpen account now or learn more about trading share CFDs with FXOpen.
This article represents the opinion of the Companies operating under the FXOpen brand only. It is not to be construed as an offer, solicitation, or recommendation with respect to products and services provided by the Companies operating under the FXOpen brand, nor is it to be considered financial advice.
Stay ahead of the market!
Subscribe now to our mailing list and receive the latest market news and insights delivered directly to your inbox.


Latest articles

Market Analysis: GBP/USD Dips Further As EUR/GBP Regains Traction
GBP/USD failed to climb above 1.3500 and corrected some gains. EUR/GBP started a decent increase and might aim for more gains above 0.8700.
Important Takeaways for GBP/USD and EUR/GBP Analysis Today
· The British Pound


Market Insights with Gary Thomson: Oil, US Retail Sales & NFP in Focus
In this video, we’ll explore the key economic events and market trends, shaping the financial landscape. Get ready for insights into financial markets to help you navigate the week ahead. Let’s dive in!
In this episode of Market