


FXOpen

Yesterday, after the main trading session on the Nasdaq, Microsoft released its second-quarter report:
→ Earnings per share: actual = $2.95, forecast = $2.93;
→ Gross revenue: actual = $64.72 billion, forecast = $64.38 billion.
Despite key figures exceeding analyst expectations, MSFT's share price plummeted, falling below the psychological threshold of $400 in after-hours trading.
Investor disappointment may have been caused by the slowdown in growth of its cloud business and significant financial investments in AI infrastructure—a long-term investment with delayed payback.
Could the decline continue?
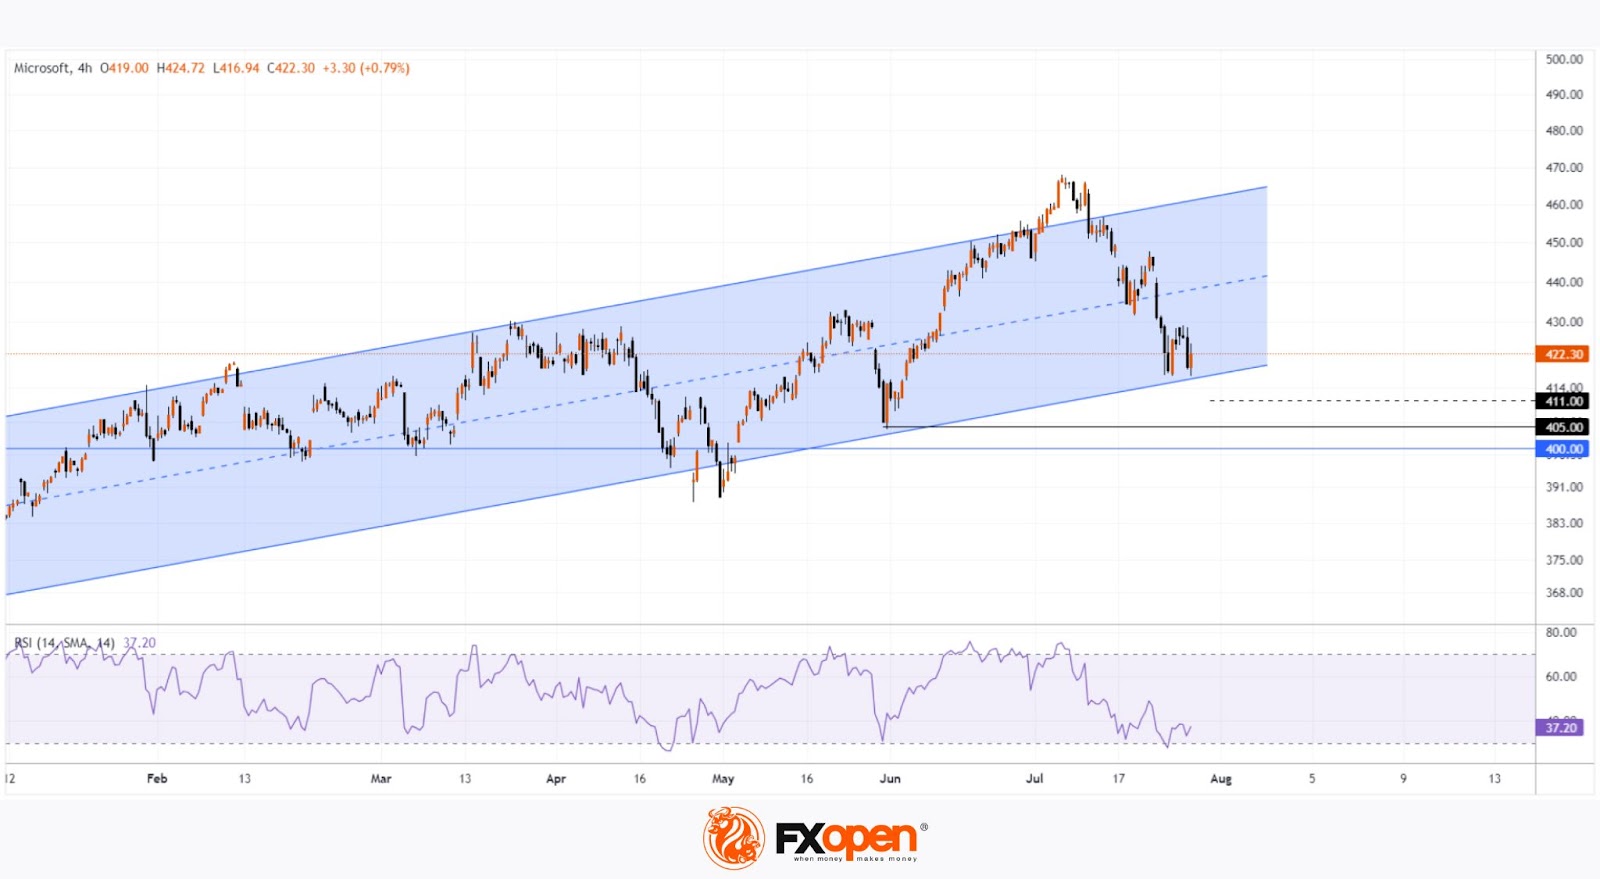
Today in pre-market trading, MSFT's price recovered to $411, suggesting that the initial negative reaction to the report may have been overly pessimistic. Additionally, there might have been a cascade of stop-loss liquidations below $400 and the June low around $405, which seemed "secure" when the price was above $460.
Technical analysis of MSFT’s chart shows that price action in 2024 formed an ascending blue channel. If the pre-market price doesn’t change significantly, today’s opening will be just below the channel’s lower boundary. If the RSI considered extended hours data, it might indicate exiting a deeply oversold zone (similar signals in 2024 had profit potential).
If the sharp decline followed by a strong recovery signifies the liquidation of speculators (likely given the approximately 24% rise from the start of the year to mid-July), then MSFT's price could return to the blue channel and resume growth within it (channel boundaries might need adjustment).
Wall Street analysts remain positive. According to TipRanks, the average MSFT forecast is $509.42 within 12 months (above the historical high). All 26 surveyed analysts recommend buying MSFT stock.
Buy and sell stocks of the world's biggest publicly-listed companies with CFDs on FXOpen’s trading platform. Open your FXOpen account now or learn more about trading share CFDs with FXOpen.
This article represents the opinion of the Companies operating under the FXOpen brand only. It is not to be construed as an offer, solicitation, or recommendation with respect to products and services provided by the Companies operating under the FXOpen brand, nor is it to be considered financial advice.
Stay ahead of the market!
Subscribe now to our mailing list and receive the latest market news and insights delivered directly to your inbox.


Latest articles

Gold Price Holds Near Key Support
As the XAU/USD chart shows, the gold price has been holding within the $5,060–$5,200 range over the past several sessions.
Bullish view: the key support is the lower boundary of the long-term channel that has been

EUR/USD Chart Analysis: Pair Rebounds from the Year’s Low
Analysing the EUR/USD chart five days ago, we:
→ constructed a downward channel, noting signs that the bears remained in control;
→ outlined a scenario in which the rate would decline to a new yearly low (and test the lower boundary

Dollar Index (DXY) Hits Yearly High
Today, the dollar index rose above last week’s peak around the 99.68 level, setting a new high for 2026. This movement is supported by a tense fundamental backdrop:
→ Inflationary pressures from rising oil prices. Markets may be pricing