


MSFT Shares Surge on Record Yearly Volumes
FXOpen

On Friday, 31 May, almost 48 million Microsoft shares were traded on the NASDAQ – the highest number since the start of 2024. Meanwhile, the MSFT price chart formed a “hammer” candle:
→ trading opened at $416.75 per MSFT share;
→ mid-session, the price dropped below $406;
→ however, by the end of trading, the price had recovered to $415.13.
Fundamentally, it is difficult to pinpoint a single piece of news that served as the bullish driver. According to Barron's, a significant incentive for investing in MSFT shares should be considered the prospect of high dividend payouts.
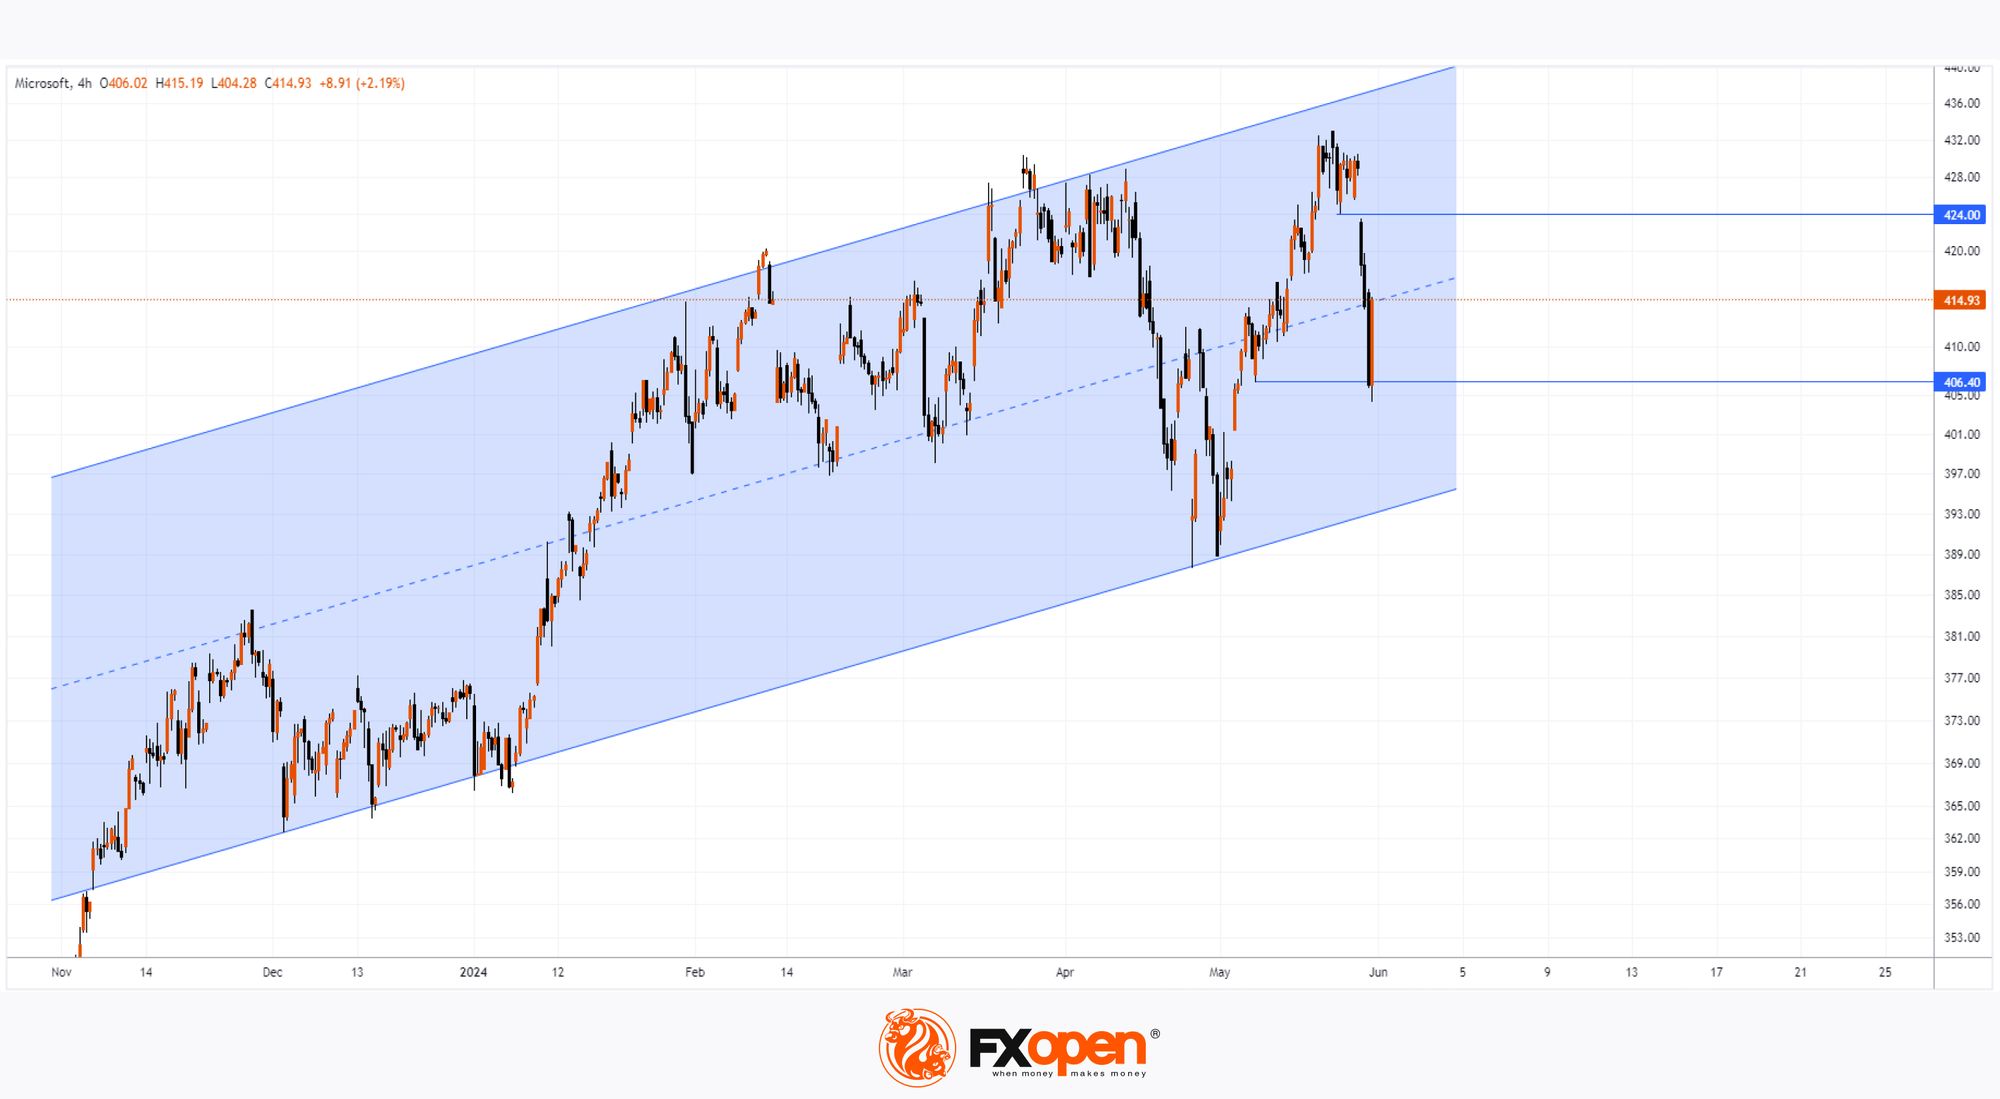
From the perspective of MSFT chart technical analysis, the price action can be interpreted as evidence of demand absorbing all selling pressure:
→ the share price is within an ascending channel;
→ having dropped to the $406 level, the price pierced the $406.40 support from 8 May – this likely triggered mass activation of buyers' stop-losses and led to a shift in the balance of buyers and sellers;
→ in the pre-market today, the MSFT price is around the median – thus, it can be assumed that the market will consolidate at the beginning of the week. If Friday's bullish momentum continues, the price may encounter resistance around the bearish gap at $424 per MSFT share.
A crucial driver for the price of MSFT and other market leaders in the near future will be the upcoming Fed meeting on interest rates, scheduled for Wednesday, 12 June.
According to TipRanks, the average forecasted price of MSFT shares in 12 months is $491.90 (+18.49% from current levels).
Buy and sell stocks of the world's biggest publicly-listed companies with CFDs on FXOpen’s trading platform. Open your FXOpen account now or learn more about trading share CFDs with FXOpen.
This article represents the opinion of the Companies operating under the FXOpen brand only. It is not to be construed as an offer, solicitation, or recommendation with respect to products and services provided by the Companies operating under the FXOpen brand, nor is it to be considered financial advice.
Stay ahead of the market!
Subscribe now to our mailing list and receive the latest market news and insights delivered directly to your inbox.


Latest articles


Market Repricing of Risk as Gold Loses Safe-Haven Demand
Geopolitical tensions in the Middle East had remained the primary macro driver for the gold market over recent weeks; however, on 8 April the situation shifted sharply as the United States and Iran agreed to a temporary two-week ceasefire, including

Commodity Currencies on the Rise: Market Focus Shifts to US and Canadian Data
Commodity-linked currencies continue to strengthen, while the US dollar remains under pressure amid easing geopolitical tensions and a shift in investor preference towards riskier assets. Reports of a temporary ceasefire between the US and Iran have helped stabilise sentiment and