


MSFT Stocks: Fundamental vs. Technical Analysis
FXOpen

This week 166 companies that make up 33% of the S&P 500 index will publish their reports for the second quarter. Among them, the second largest company in the index, Microsoft. And here, an interesting situation develops: the fundamental background is quite strong, and technical analysis shows signs of weakness. Judge for yourself.
Fundamental analysis:
- the Android version of the sensational ChatGPT will be released this week;
- Fundstrat analysts see a target price for MSFT shares of around USD 380 in the short term and USD 426 in the long term;
- Barclays analysts have rated MSFT stock as a Buy with a target of USD 425 (previous MSFT share price target of USD 425) amid Microsoft 365 AI rollout.
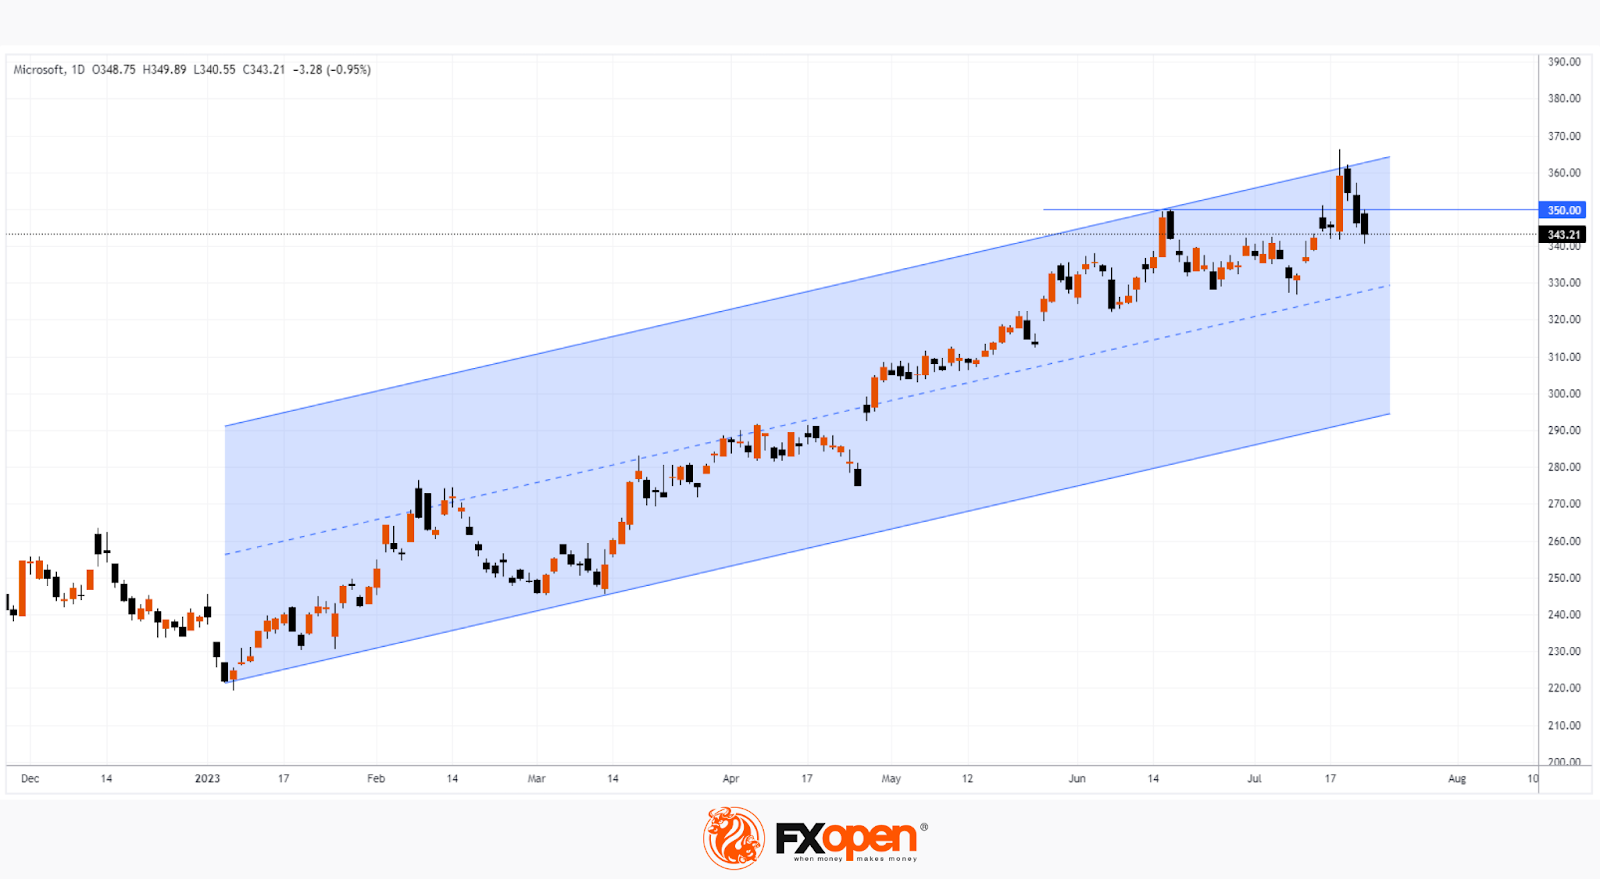
However, let's evaluate the MSFT stock chart from the point of view of technical analysis. Note that after a sharp breakdown of the psychological level of USD 350 on July 18, 3 days of rollback followed, which completely leveled the progress of the bulls and lowered the stock price back below USD 350; Friday's low is below the low of July 18, which can be interpreted as a shortage of buyers after a bullish breakdown. The attack of the bulls did not attract followers. Thus, the market, by its behavior, casts doubt on the scenario of further growth, which can be imagined on the basis of a strong fundamental.
Fundamental or technical analysis? We will find out on Tuesday after the close of the main session, when the Microsoft report is released.
Buy and sell stocks of the world's biggest publicly-listed companies with CFDs on FXOpen’s trading platform. Open your FXOpen account now or learn more about trading share CFDs with FXOpen.
This article represents the opinion of the Companies operating under the FXOpen brand only. It is not to be construed as an offer, solicitation, or recommendation with respect to products and services provided by the Companies operating under the FXOpen brand, nor is it to be considered financial advice.
Stay ahead of the market!
Subscribe now to our mailing list and receive the latest market news and insights delivered directly to your inbox.


Latest articles

AUD/CAD: Months of Indecision — Is a Breakout Finally Coming?
The Australian dollar has clawed back most of its end-of-June losses, when it touched three-month lows against the greenback amid escalating Middle East tensions. Since then, sentiment has improved: the RBA's Assistant Governor Sarah Hunter signalled the board stands ready

USD/JPY: Battling at the Top of the Triangle
On 3 July, Japan's Finance Minister, Satsuki Katayama, stated that the Ministry of Finance remains in close contact with US authorities regarding developments in USD/JPY as the yen traded near its weakest level in almost 40 years. Similar verbal

Dow Jones (DJIA): Consolidation Beyond the Trend
Federal Reserve Chair Kevin Warsh testified before Congress on 14–15 July, reaffirming the Fed's commitment to bringing inflation back to target while providing no clear guidance on the future path of interest rates. Meanwhile, June inflation data came in