


Nasdaq 100 Index: A Ray of Hope
FXOpen

On July 31, we noted that the Nasdaq 100 (US Tech 100 mini on FXOpen) had reached significant support, highlighting trendline A and warning of potential volatility spikes due to fundamental news from the Federal Reserve and earnings season.
Since then, the price of the Nasdaq 100 (US Tech 100 mini on FXOpen):
→ Jumped to the 19540 level;
→ But encountered resistance there (indicated by an arrow), as this was previous support;
→ And returned to trendline A.
Thus, we have an argument that can be interpreted as the bulls' inability to resume the upward trend. The bears seized the opportunity to take control and break below trendline A on August 2.
Contributing factors included:
→ The decline in the Japanese stock market, which we wrote about yesterday. It is possible that the extremely strong sell-off of Japanese company shares affected sentiments in the US.
→ Increasing talks of a recession due to very weak US labour market data (published on Friday, which we also covered yesterday).
At the low point yesterday, the Nasdaq 100 (US Tech 100 mini on FXOpen) dropped by 7% from Friday's close. Of course, this isn't comparable to March 16, 2020, when the index fell by 12.32%, or October 19, 1987 (known as "Black Monday"), when it dropped by 11.35%. Nonetheless, the mood was grim – as CNBC reports, the stock market had its worst day in about two years. The RSI index fell to the oversold boundary.
But not all is bleak.
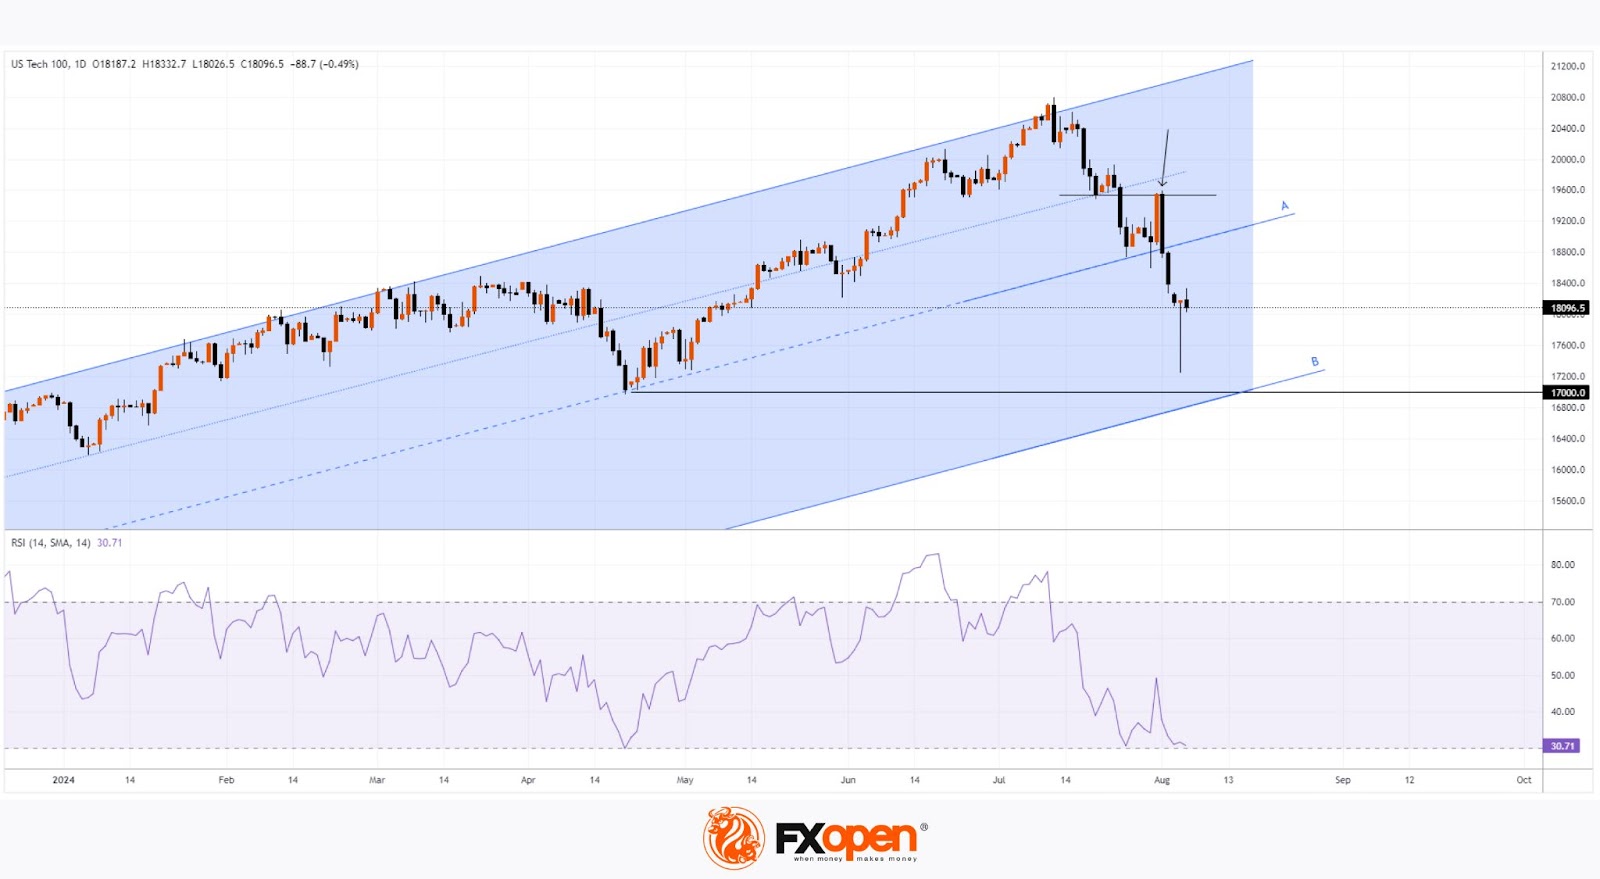
Technical analysis of the Nasdaq 100 (US Tech 100 mini on FXOpen) chart shows that:
→ The price is near line B, which is drawn parallel to line A at a distance equal to the height of the previous channel.
→ And this line B shows signs of support – by Monday's close, the bulls managed to reclaim almost all the progress made by the bears since the start of the session.
→ Yesterday's candlestick forms a "Hammer" pattern, which is a reversal pattern appearing after a decline and suggests seller capitulation and a potential upward reversal.
→ In the background is the important April low around the psychological level of 17k.
According to CandleScanner's research on the US stock market over 20 years, this pattern failed in about 21% of cases. Therefore, signs of weakening selling pressure will indicate that this time the pattern, appearing near line B, may be effective.
Trade global index CFDs with zero commission and tight spreads (additional fees may apply). Open your FXOpen account now or learn more about trading index CFDs with FXOpen.
This article represents the opinion of the Companies operating under the FXOpen brand only. It is not to be construed as an offer, solicitation, or recommendation with respect to products and services provided by the Companies operating under the FXOpen brand, nor is it to be considered financial advice.
Stay ahead of the market!
Subscribe now to our mailing list and receive the latest market news and insights delivered directly to your inbox.


Latest articles

AI Valuations Are Back in the Spotlight
Artificial intelligence remains the dominant investment theme of 2026, but investors are increasingly questioning whether AI stock valuations are keeping pace with reality.
💰 Big Tech continues to invest at an unprecedented scale, with hyperscaler AI spending projected to exceed $800

AUD/CAD: Months of Indecision — Is a Breakout Finally Coming?
The Australian dollar has clawed back most of its end-of-June losses, when it touched three-month lows against the greenback amid escalating Middle East tensions. Since then, sentiment has improved: the RBA's Assistant Governor Sarah Hunter signalled the board stands ready

USD/JPY: Battling at the Top of the Triangle
On 3 July, Japan's Finance Minister, Satsuki Katayama, stated that the Ministry of Finance remains in close contact with US authorities regarding developments in USD/JPY as the yen traded near its weakest level in almost 40 years. Similar verbal