


FXOpen

As indicated by the Nasdaq 100 chart (US Tech 100 mini on FXOpen), yesterday's decline was -2.62% in a single session.
Thus, tech stocks experienced the sharpest drop since late 2022, with around 75% of companies in the Nasdaq 100 index closing in the red.
Alphabet (GOOG) shares, the parent company of Google, fell by 4.9% due to higher-than-expected AI expenses and disappointing YouTube advertising revenues.
Tesla (TSLA) shares dropped by 12% due to a 7% decline in automotive revenue, missed earnings, and delays in the Robotaxi project.
Chipmaker stocks also suffered losses.
What is the reason for the Nasdaq 100 (US Tech 100 mini on FXOpen) price decline?
According to Business Insider, renowned Wall Street investor Ed Yardeni believes that:
→ Major market players started exiting tech stocks on July 11, as news of low inflation motivated them to rotate and shift capital into stocks sensitive to the anticipated interest rate cuts;
→ The stock market is overbought and undergoing a minor correction.
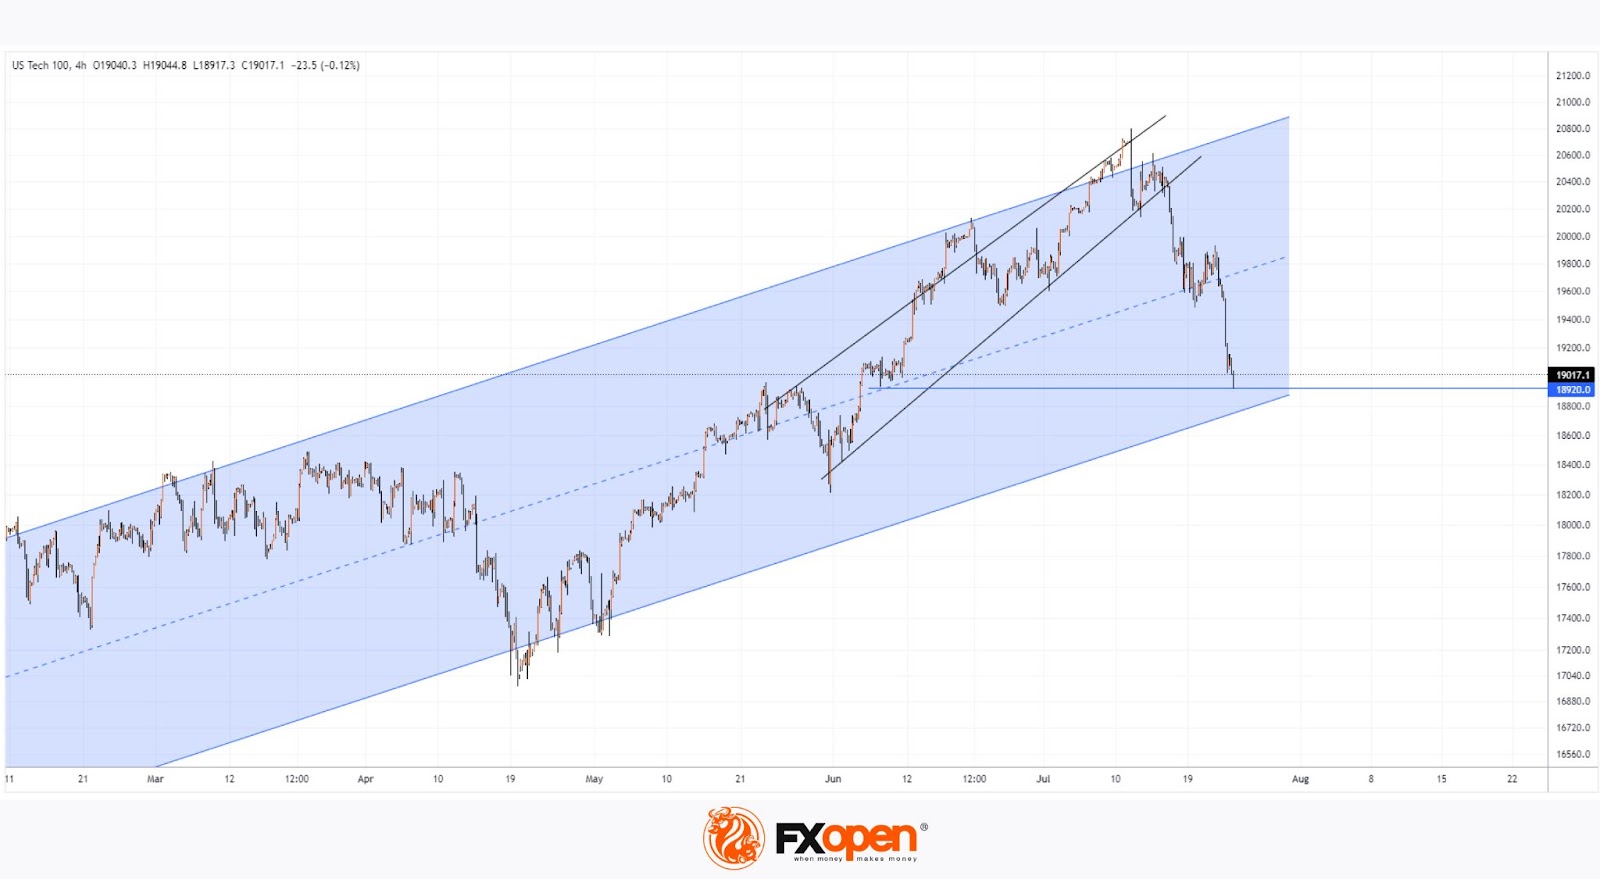
Technical analysis of the Nasdaq 100 (US Tech 100 mini on FXOpen) chart provides more details:
→ The price has been in an uptrend in 2024 (shown in blue) but made a bearish reversal from the upper boundary in mid-July. This week, it aggressively moved down with wide bearish candles into the lower half of the channel;
→ The lower boundary of the channel and the support level at 18920 (in effect at the beginning of June) form a block that bulls are pinning their hopes on.
If the stock market is indeed experiencing a minor sell-off to move out of an overbought state, this support block might act as a brake and slow down the pace of the Nasdaq 100 (US Tech 100 mini on FXOpen) price decline observed this week.
Trade global index CFDs with zero commission and tight spreads (additional fees may apply). Open your FXOpen account now or learn more about trading index CFDs with FXOpen.
This article represents the opinion of the Companies operating under the FXOpen brand only. It is not to be construed as an offer, solicitation, or recommendation with respect to products and services provided by the Companies operating under the FXOpen brand, nor is it to be considered financial advice.
Stay ahead of the market!
Subscribe now to our mailing list and receive the latest market news and insights delivered directly to your inbox.


Latest articles

Gold Price Holds Near Key Support
As the XAU/USD chart shows, the gold price has been holding within the $5,060–$5,200 range over the past several sessions.
Bullish view: the key support is the lower boundary of the long-term channel that has been

EUR/USD Chart Analysis: Pair Rebounds from the Year’s Low
Analysing the EUR/USD chart five days ago, we:
→ constructed a downward channel, noting signs that the bears remained in control;
→ outlined a scenario in which the rate would decline to a new yearly low (and test the lower boundary

Dollar Index (DXY) Hits Yearly High
Today, the dollar index rose above last week’s peak around the 99.68 level, setting a new high for 2026. This movement is supported by a tense fundamental backdrop:
→ Inflationary pressures from rising oil prices. Markets may be pricing