


FXOpen

Forecasts of a hotter summer, published during April and May, led to a sustained bullish trend in the natural gas market, as this commodity is heavily used for air conditioning.
Specifically:
→ The XNG/USD chart indicates that from 1st April to today, the price of natural gas has increased by more than 55%.
→ According to Bloomberg, there is a 61% chance that 2024 will be the hottest year on record, surpassing 2023.
→ Natural gas supplies may be unstable due to an unforeseen maintenance shutdown at the Freeport plant.
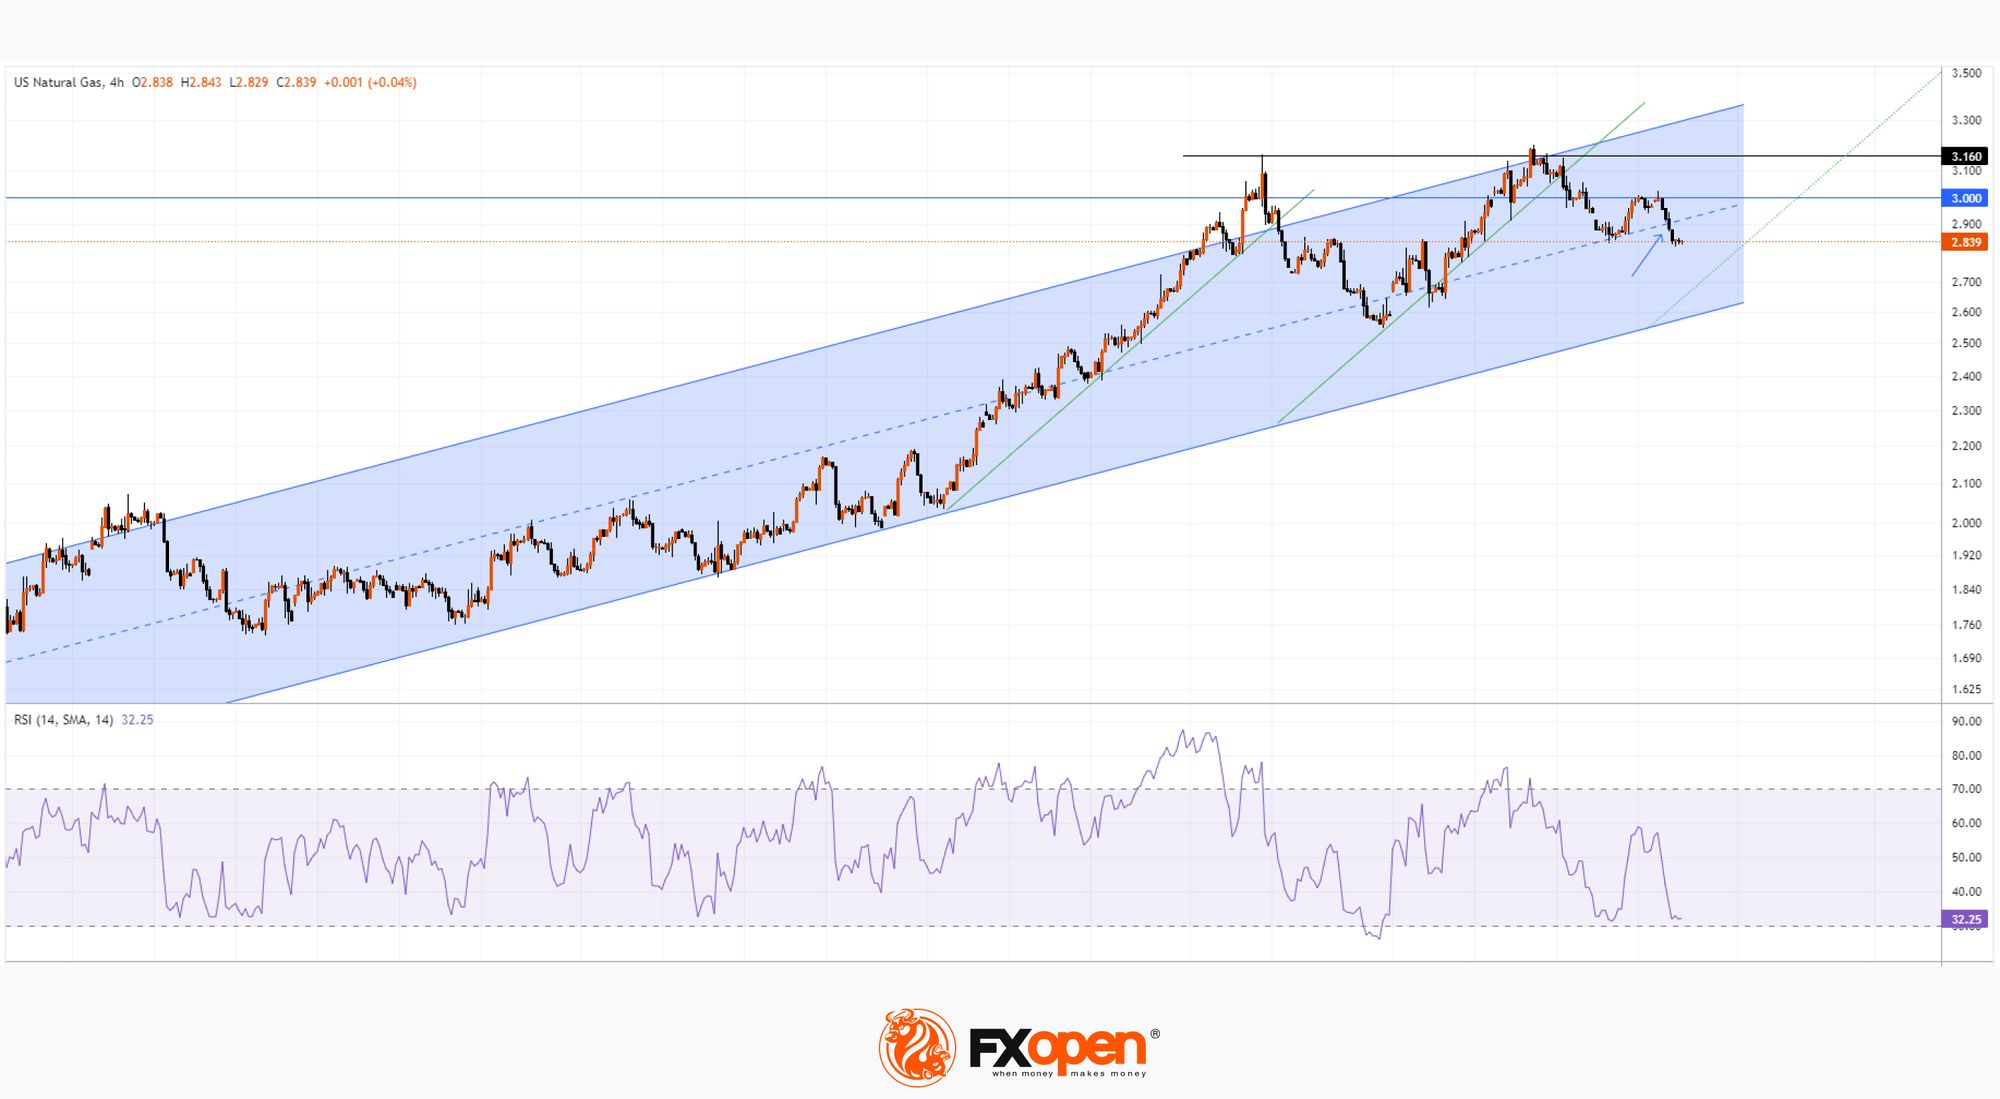
According to the technical analysis of the 4-hour XNG/USD chart:
→ The price of natural gas has formed an ascending channel (shown in blue).
→ On 23rd May, the price reached a 2024 high around the 3.160 level, breaking the upper boundary and entering the overbought zone on the RSI indicator.
→ On 11th June, this high was marginally exceeded, but the price then turned down, forming a false bullish breakout pattern.
Thus, the 3.160 level appears to adequately factor in the risks of an extremely hot summer. Therefore, the bullish trend weakens as it approaches this level.
Meanwhile, bears are becoming more active, indicated by:
→ The price of natural gas twice breaking below the green lines of intermediate upward trends.
→ The price broke below the median line of the blue channel (shown by the arrow).
→ This week, the psychological level of 3.000 acted as resistance.
It is possible that the bears could drive the price down to the lower boundary of the blue channel.
Start trading commodity CFDs with tight spreads (additional fees may apply). Open your trading account now or learn more about trading commodity CFDs with FXOpen.
This article represents the opinion of the Companies operating under the FXOpen brand only. It is not to be construed as an offer, solicitation, or recommendation with respect to products and services provided by the Companies operating under the FXOpen brand, nor is it to be considered financial advice.
Stay ahead of the market!
Subscribe now to our mailing list and receive the latest market news and insights delivered directly to your inbox.


Latest articles

Consolidation Ahead of NFP: Commodity Currencies Search for Direction
Commodity-linked currencies have entered a consolidation phase following recent directional moves, as market participants adopt a wait-and-see approach ahead of key US labour market data. Current price action reflects a balance between ongoing demand for the US dollar and attempts

The Real Driver Behind the Dollar Rally: Market Insights with Gary Thomson
The US dollar has been firm, but the drivers behind the move may be more complex than they first appear.
While geopolitical tension and shifts in risk sentiment play a role, current price behaviour seems increasingly influenced by inflation expectations

EUR/USD and USD/CHF Pull Back: Market Reacts to Fundamentals
European currencies have shown a recovery in recent trading sessions after their recent decline, displaying early signs of a reversal. The US dollar is weakening amid expectations surrounding upcoming US macroeconomic data, while market participants are reassessing their short-term positions