


Natural Gas Price Hits 2.5-Month High
FXOpen

As the XNG/USD chart shows today, natural gas prices have risen above $3.600/MMBtu for the first time since mid-July.
According to media reports, the rise in gas prices has been driven by:
→ Weather models forecasting colder conditions, suggesting the heating season may begin earlier than expected;
→ An EBW Analytics Group note highlighting short-covering activity in the market, which has accelerated the rally (a short squeeze effect).
At the same time, chart analysis suggests that the upside potential may be limited.
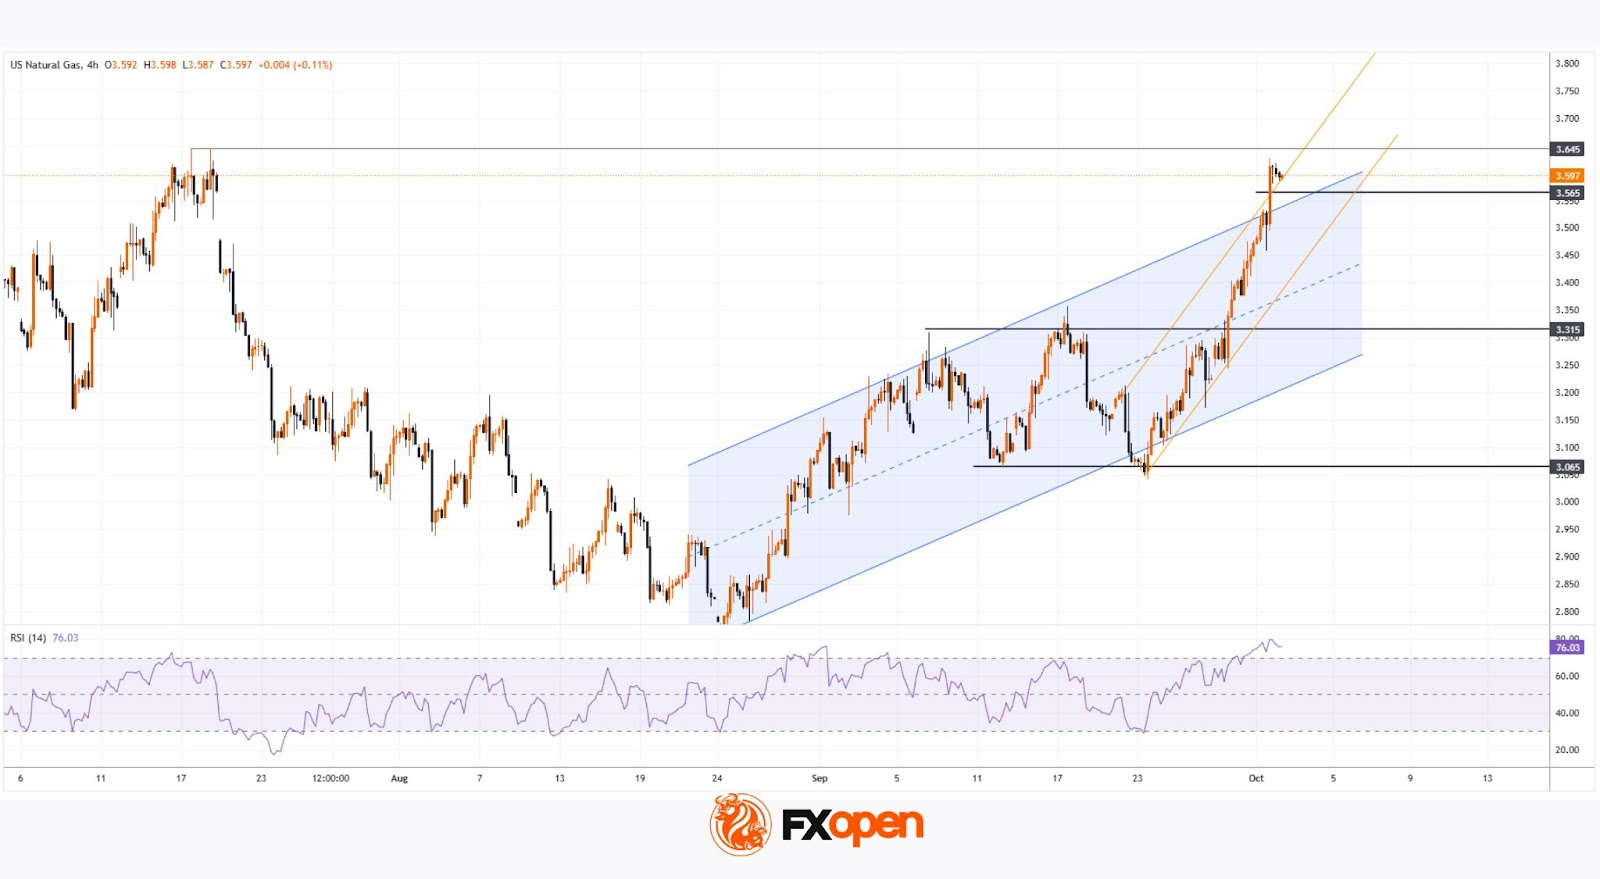
Technical Analysis of the XNG/USD Chart
Three factors might restrict further price growth:
→ The RSI indicator signals extreme overbought conditions.
→ Price has moved above the upper boundary of the channel (which has been in place since August), indicating that natural gas may be overvalued.
→ If we view September’s moves as a 3.065–3.315 range, then the target following the breakout on 29 September should be calculated based on the range height — pointing to 3.645. This target has already been reached.
Thus, we could assume that the market is vulnerable to a pullback (for example, towards the median of the blue channel). At the same time, the steep upward trajectory (highlighted in orange) remains intact.
Therefore, we may see an attempt at a bullish breakout of the July high near the 3.65 level — although, given the factors mentioned above, such a breakout could well prove to be a false one.
Start trading commodity CFDs with tight spreads (additional fees may apply). Open your trading account now or learn more about trading commodity CFDs with FXOpen.
This article represents the opinion of the Companies operating under the FXOpen brand only. It is not to be construed as an offer, solicitation, or recommendation with respect to products and services provided by the Companies operating under the FXOpen brand, nor is it to be considered financial advice.
Stay ahead of the market!
Subscribe now to our mailing list and receive the latest market news and insights delivered directly to your inbox.


Latest articles

NZD/USD Analysis: A Tug-of-War at the Critical Level
The kiwi has strengthened meaningfully against most peers this month. However, against the US dollar specifically, NZD/USD remains well below its 2026 highs, trading in the mid-0.58 area versus January's peak near 0.6075.
New Zealand's Q2 inflation

AUD/USD and USD/CAD React to Rising Geopolitical Risks
Commodity-linked currencies remain under pressure as geopolitical tensions in the Middle East continue to escalate. The United States has maintained strikes on targets in Iran, while the Tehran-backed Houthis have intensified threats to shipping in the Red Sea and near

GBP/CHF: Trendline or RSI — Which One Is Lying?
Sterling enters this week on firmer footing, with political uncertainty fading fast after Andy Burnham's confirmation as Labour leader eased investor concerns over the succession to Keir Starmer. Markets reacted further to reports pointing to Shabana Mahmood as the frontrunner