


FXOpen
According to the XNG/USD chart, natural gas prices have risen by approximately 13% since early November and this week hit a new 2024 high.
Factors Driving Bullish Sentiment (as reported by Reuters):
→ A sharp increase in global gas prices.
→ Forecasts of colder weather and higher heating demand in the United States.
Will Natural Gas Prices Continue to Rise?
From a fundamental perspective, the Energy Information Administration (EIA) forecast on 13 November predicts natural gas prices could peak in January 2025.
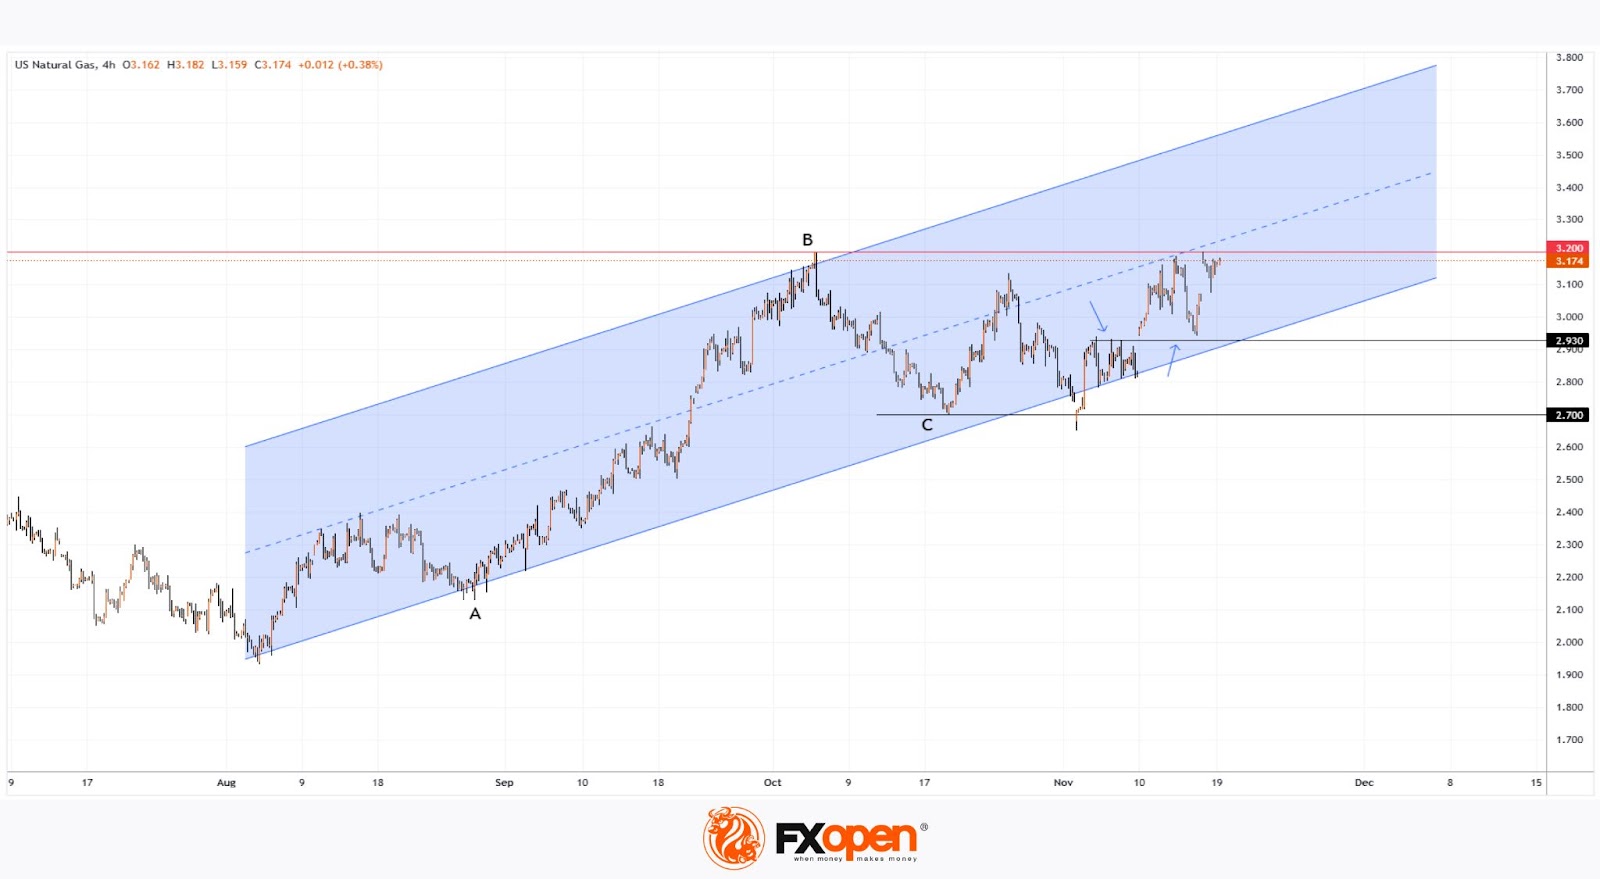
From a technical analysis standpoint of the XNG/USD chart, the $3.200 level is a critical resistance, having previously triggered price reversals in October (B) and June (not shown on the chart). Price movements since early August have formed a trend channel (shown in blue).
Bullish Arguments:
→ The $2.7 level serves as support, aligned with Fibonacci retracement levels, as the B→C pullback is at 50% of the A→B rise.
→ The $2.93 level has flipped from resistance to support (indicated by arrows).
Bearish Arguments:
→ Prices reversed sharply downward earlier this week from the $3.200 level, showing seller activity.
→ Reports indicate utilities are injecting gas into storage at faster-than-expected rates, suggesting stockpiles could meet increased cold-weather demand.
Bulls may attempt to keep prices within the blue channel and make further attempts to breach the $3.200 level. However, XNG/USD signals show that bears are ready to push back.
Start trading commodity CFDs with tight spreads (additional fees may apply). Open your trading account now or learn more about trading commodity CFDs with FXOpen.
This article represents the opinion of the Companies operating under the FXOpen brand only. It is not to be construed as an offer, solicitation, or recommendation with respect to products and services provided by the Companies operating under the FXOpen brand, nor is it to be considered financial advice.
Stay ahead of the market!
Subscribe now to our mailing list and receive the latest market news and insights delivered directly to your inbox.


Latest articles

Market Analysis: GBP/USD Dips Further As EUR/GBP Regains Traction
GBP/USD failed to climb above 1.3500 and corrected some gains. EUR/GBP started a decent increase and might aim for more gains above 0.8700.
Important Takeaways for GBP/USD and EUR/GBP Analysis Today
· The British Pound


Market Insights with Gary Thomson: Oil, US Retail Sales & NFP in Focus
In this video, we’ll explore the key economic events and market trends, shaping the financial landscape. Get ready for insights into financial markets to help you navigate the week ahead. Let’s dive in!
In this episode of Market