


FXOpen

On 19 November, we analysed the natural gas price chart, noting:
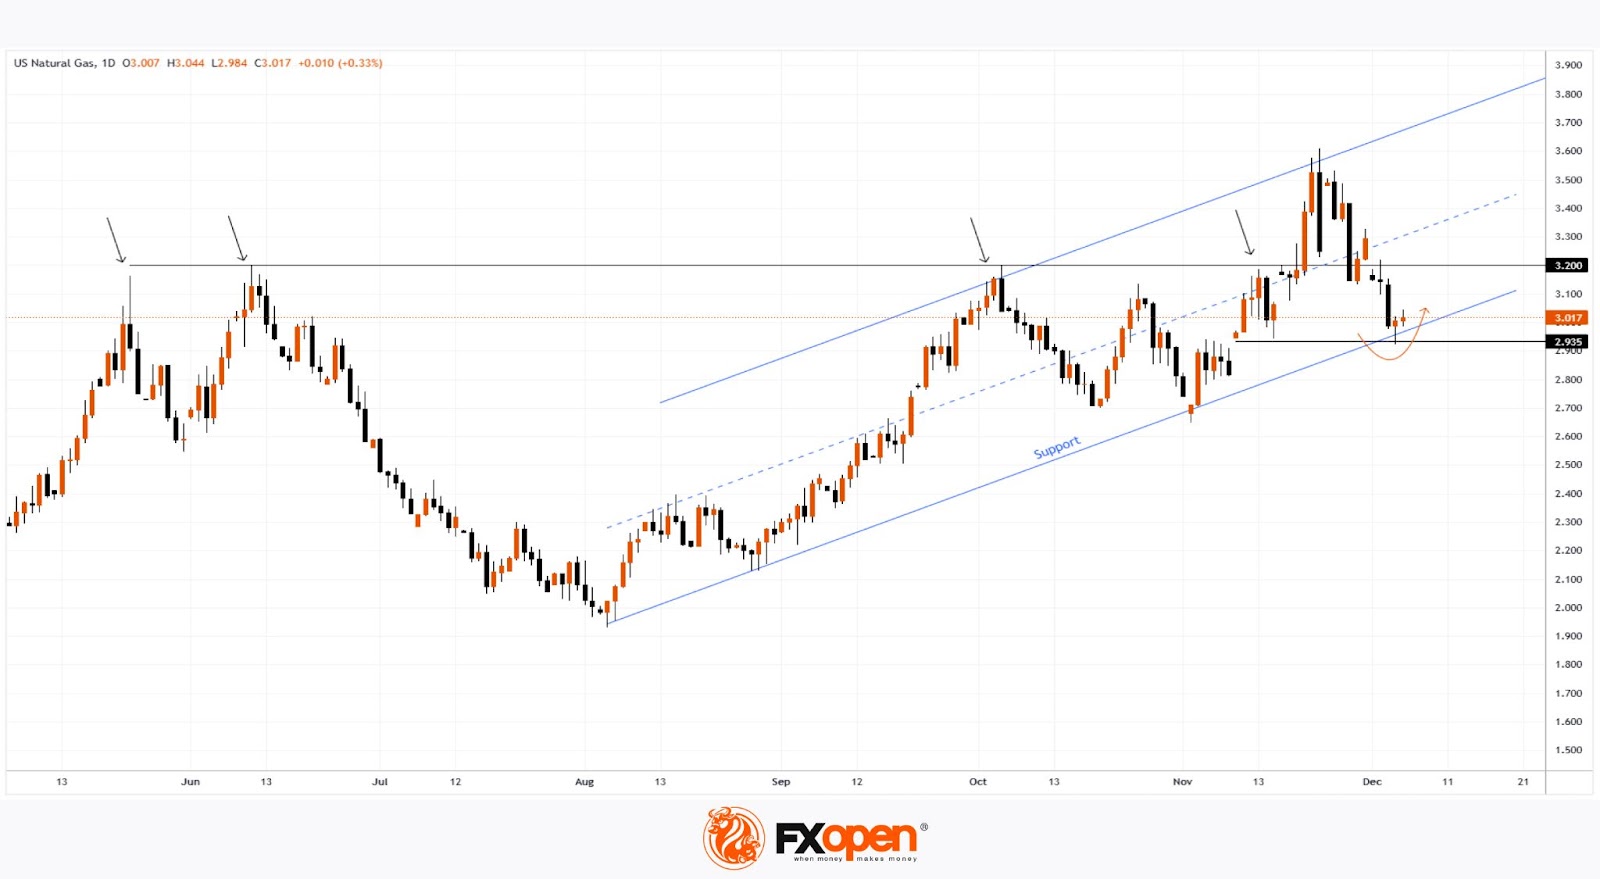
→ the formation of an upward channel (marked in blue);
→ a potential bullish attempt to break the key $3.200 level, which had acted as resistance (highlighted with arrows).
As seen on the XNG/USD chart, the price did rise above $3.200 but failed to hold. After fluctuating in the upper half of the channel, it dropped below $3.200 to the channel's lower boundary, driven by:
→ a bearish report from the Energy Information Administration, showing US gas inventories above the five-year average;
→ a report from financial firm LSEG noting increased average gas production across 48 US states.
This decline pushed natural gas prices to a 2.5-month low around the $2.935 level.
What Could Happen Next?
From a technical perspective on the XNG/USD chart:
→ support from the channel's lower boundary (reinforced by the psychological $3.000 mark) is already evident in an emerging price reversal (indicated by an arrow);
→ on the other hand, the $3.200 level may resume acting as resistance.
It’s likely that natural gas prices will fluctuate between $3.000 and $3.200, with weather forecasts playing a decisive role in shaping consumption expectations for the winter season.
Start trading commodity CFDs with tight spreads (additional fees may apply). Open your trading account now or learn more about trading commodity CFDs with FXOpen.
This article represents the opinion of the Companies operating under the FXOpen brand only. It is not to be construed as an offer, solicitation, or recommendation with respect to products and services provided by the Companies operating under the FXOpen brand, nor is it to be considered financial advice.
Stay ahead of the market!
Subscribe now to our mailing list and receive the latest market news and insights delivered directly to your inbox.


Latest articles

Gold Price Holds Near Key Support
As the XAU/USD chart shows, the gold price has been holding within the $5,060–$5,200 range over the past several sessions.
Bullish view: the key support is the lower boundary of the long-term channel that has been

EUR/USD Chart Analysis: Pair Rebounds from the Year’s Low
Analysing the EUR/USD chart five days ago, we:
→ constructed a downward channel, noting signs that the bears remained in control;
→ outlined a scenario in which the rate would decline to a new yearly low (and test the lower boundary

Dollar Index (DXY) Hits Yearly High
Today, the dollar index rose above last week’s peak around the 99.68 level, setting a new high for 2026. This movement is supported by a tense fundamental backdrop:
→ Inflationary pressures from rising oil prices. Markets may be pricing