


FXOpen

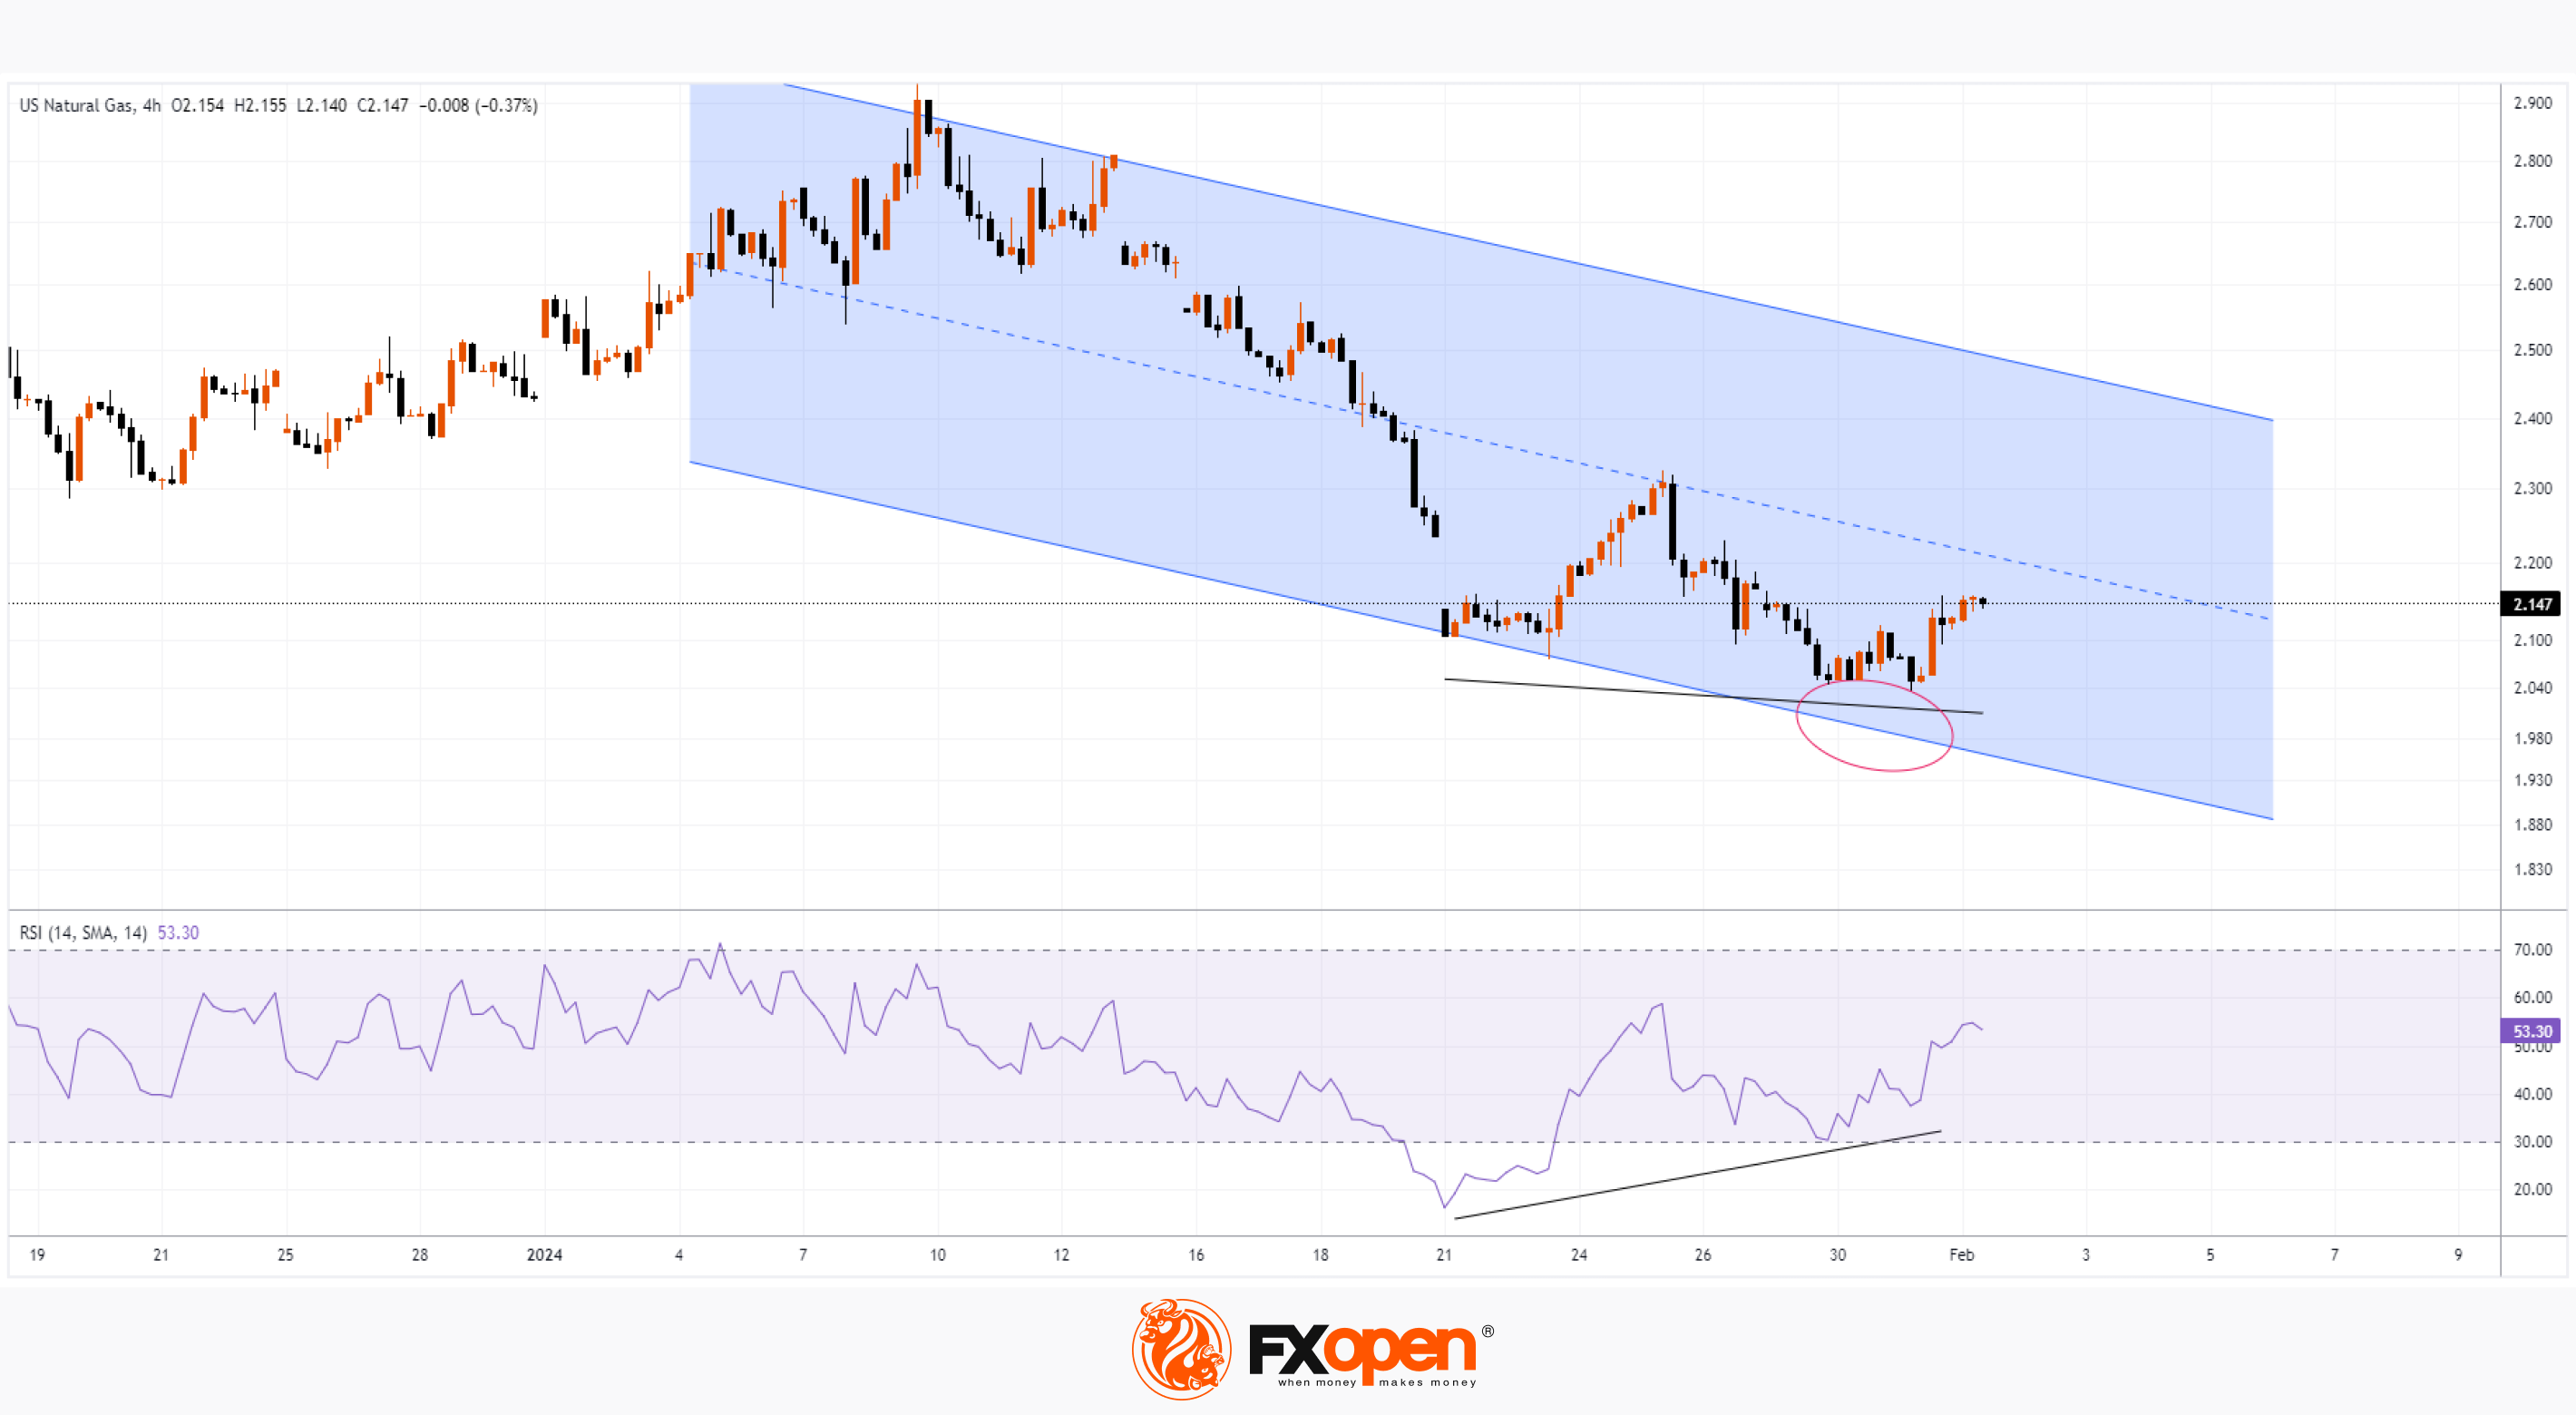
As the chart shows, the price of XNG fell below 2.040 on January 31 for the first time since August 2020. This was facilitated by:
→ seasonal trend, because towards the end of winter the price of natural gas tends to fall;
→ weather data. Temperatures could remain above average and snowfall amounts will decrease across North America, according to the U.S. Climate Prediction Center and AccuWeather.
However, the chart shows signs of increased demand:
→ the RSI indicator forms divergence;
→ the bears were unable to reach the lower boundary (shown on the chart) of the downward channel.
Signs of increased demand could come from short covering after the XNG price fell by more than 25% this year, as well as sentiment ahead of the release of news on gas reserves (today at 18:30 GMT+3).
It is possible that the news release will provoke even greater demand activity, and the XNG price will reach the median line of the shown channel.
Start trading commodity CFDs with tight spreads. Open your trading account now or learn more about trading commodity CFDs with FXOpen.
This article represents the opinion of the Companies operating under the FXOpen brand only. It is not to be construed as an offer, solicitation, or recommendation with respect to products and services provided by the Companies operating under the FXOpen brand, nor is it to be considered financial advice.
Stay ahead of the market!
Subscribe now to our mailing list and receive the latest market news and insights delivered directly to your inbox.


Latest articles

The US Dollar Index (DXY) Rebounds from a Two-Month Low
A week ago, we:
→ updated a system of two trend channels;
→ identified signs of selling pressure dominance;
→ outlined a scenario in which price could slide towards the lower boundary of the blue channel, potentially acting as key support.
As the

Tesla (TSLA) Shares Close at a Record High
On Tuesday, 16 December 2025, Tesla shares closed at a new all-time high, breaking above the $488 level.
As a result, TSLA:
→ surpassed its December 2024 peak;
→ is up by roughly 125% from this year’s lows;
→ made Elon Musk

USD/JPY and USD/CAD Under Pressure After Weak US Labour Market Data
The US jobs report for November, released yesterday, reinforced the downward momentum in the dollar. The Department of Labor reported that non-farm payrolls rose by just 64,000, only slightly above analysts’ expectations and signalling a fragile recovery in the