


FXOpen
Netflix (NFLX) shares reached a record high in a dynamic move. As shown in Netflix's stock chart, the price hit an all-time peak, with Friday’s candle closing above $760. This follows an aggressive rebound, given that on Thursday, the price had fallen below the psychological level of $700.
This sharp move created a significant bullish gap, with the difference between Thursday’s and Friday’s closing prices exceeding 11%. The catalyst for this surge in volatility was the release of Netflix's strong third-quarter results:
→ Earnings per share: Actual = $5.40, Expected = $5.11;
→ Gross revenue: Actual = $9.82 billion, Expected = $9.77 billion. Netflix also forecast a 15% growth in Q4 2024;
→ Free cash flow increased from $1.213 billion in Q2 to $2.194 billion in Q3.
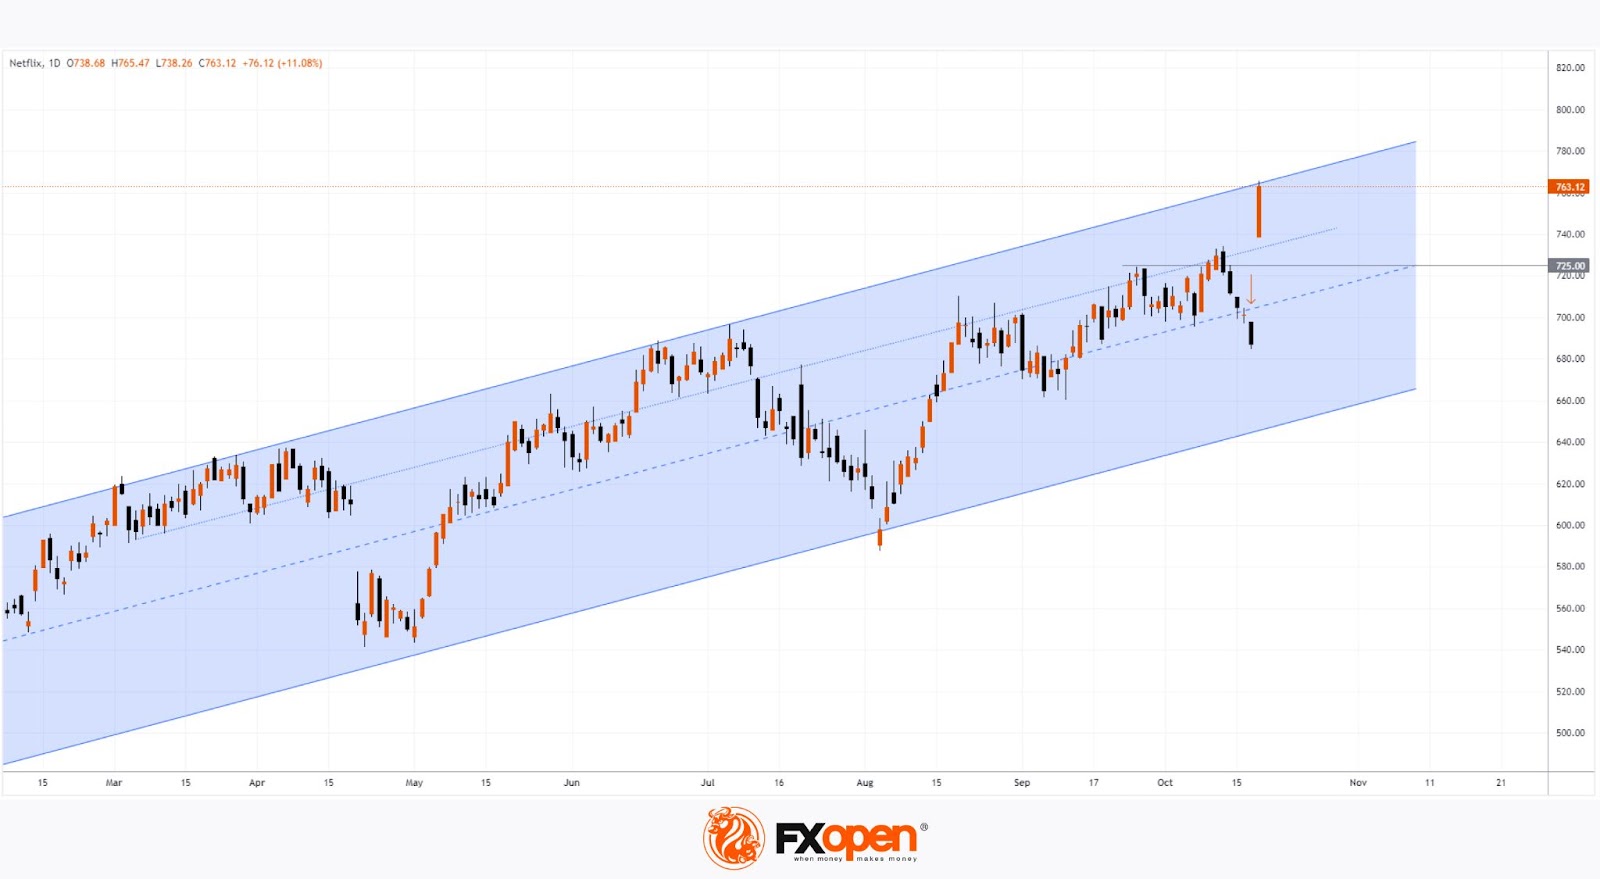
A technical analysis of Netflix's stock shows a steady upward channel throughout 2024 (depicted in blue). Thursday's drop (marked with an arrow) appears to have been a bear trap, as the chart demonstrates the potential risk of short positions, which were anticipating a drop below the $700 mark into the lower half of the upward channel.
It is notable that NFLX has now reached the upper boundary of this channel. This may prompt investors to lock in profits, potentially slowing the bullish momentum seen late last week.
If a correction occurs, potential support could be found at:
→ Psychological levels of $725 and $750;
→ The mid-line dividing the upper half of the channel into two quarters (indicated by dotted lines).
Buy and sell stocks of the world's biggest publicly-listed companies with CFDs on FXOpen’s trading platform. Open your FXOpen account now or learn more about trading share CFDs with FXOpen.
This article represents the opinion of the Companies operating under the FXOpen brand only. It is not to be construed as an offer, solicitation, or recommendation with respect to products and services provided by the Companies operating under the FXOpen brand, nor is it to be considered financial advice.
Stay ahead of the market!
Subscribe now to our mailing list and receive the latest market news and insights delivered directly to your inbox.


Latest articles

Market Analysis: GBP/USD Dips Further As EUR/GBP Regains Traction
GBP/USD failed to climb above 1.3500 and corrected some gains. EUR/GBP started a decent increase and might aim for more gains above 0.8700.
Important Takeaways for GBP/USD and EUR/GBP Analysis Today
· The British Pound


Market Insights with Gary Thomson: Oil, US Retail Sales & NFP in Focus
In this video, we’ll explore the key economic events and market trends, shaping the financial landscape. Get ready for insights into financial markets to help you navigate the week ahead. Let’s dive in!
In this episode of Market