


FXOpen

According to the chart, the Nasdaq 100 index (US Tech 100 mini on FXOpen) has climbed above the 26,260 mark for the first time in history. Market sentiment is being driven by an extraordinary combination of powerful news factors:
→ Meeting between US President Donald Trump and China’s leader Xi Jinping in Busan, South Korea. The talks lasted around one hour and forty minutes. Xi emphasised the importance of “steering the giant ship” of bilateral relations, while Trump described the meeting as “tremendous” and “fantastic”. However, few concrete details about a potential trade deal were revealed.
→ Federal Reserve rate cut. As expected, the Fed cut interest rates by 0.25% yesterday. Jerome Powell struck a cautious tone, using the metaphor of “driving through fog” to describe the lack of key inflation and labour market data due to the government shutdown. He also highlighted divisions within the committee, suggesting that another rate cut – possibly in December – remains uncertain.
→ Tech giant earnings reports. After the US stock market closed yesterday, Microsoft (MSFT), Alphabet (GOOGL), and Meta Platforms (META) released their quarterly results. A key theme across all three was massive capital expenditure on artificial intelligence. Investors are now questioning whether these heavy investments are beginning to pay off.
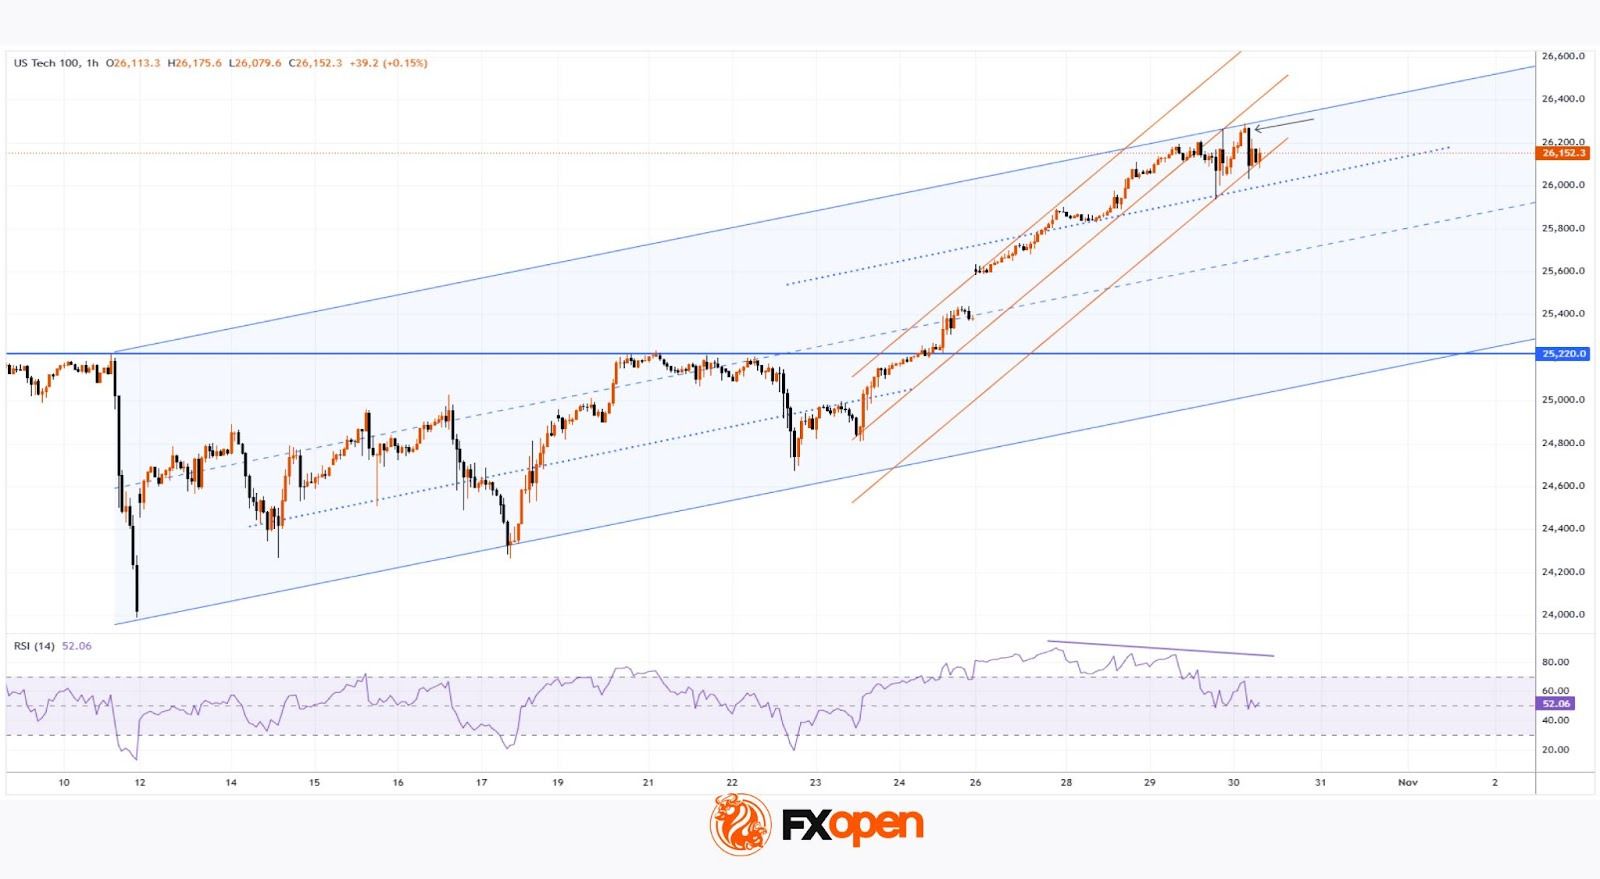
Technical analysis of the Nasdaq 100 chart
At the start of the week, when analysing the hourly chart of the Nasdaq 100 (US Tech 100 mini on FXOpen), we:
→ used the outlines of the 10 October sell-off to construct an upward channel (shown in blue);
→ drew a steeper trajectory using three orange trendlines;
→ suggested that the price target was the upper boundary of the blue channel.
That target has now been reached, and the upper boundary is showing signs of resistance — evidenced by the price slipping below the middle orange line and now being supported by the lower one.
Given the emerging RSI divergence, it is reasonable to assume that the upward momentum (+6% since the start of the month) may begin to slow. Note the recent bearish candlestick (marked by an arrow), notable for its strong move. Profit-taking could soon occur, with bears potentially attempting to push the Nasdaq 100 back down towards the median of the blue channel.
Trade global index CFDs with zero commission and tight spreads (additional fees may apply). Open your FXOpen account now or learn more about trading index CFDs with FXOpen.
This article represents the opinion of the Companies operating under the FXOpen brand only. It is not to be construed as an offer, solicitation, or recommendation with respect to products and services provided by the Companies operating under the FXOpen brand, nor is it to be considered financial advice.
Stay ahead of the market!
Subscribe now to our mailing list and receive the latest market news and insights delivered directly to your inbox.


Latest articles

EUR/USD Chart Analysis: Pair Recovers Ahead of Fed News
On 10 March, analysing the EUR/USD chart, we:
→ considered the long-term descending channel, which remains relevant;
→ noted that the sequence of lower lows A–H was broken with the appearance of a higher peak I, with 1.1680 potentially

Nvidia (NVDA) Shares Set a March High
Nvidia shares experienced heightened volatility yesterday, with the price jumping to a March high during the Nvidia GTC 2026 conference, where Jensen Huang made several major announcements. According to media reports:
→ Nvidia unveiled a next-generation platform named after the astronomer

XTI/USD Chart Analysis: WTI Oil Price Fluctuates Near $100
For the third Monday in a row, trading in the oil market has opened with a bullish gap, although this time it is not as wide as the gap seen, for example, on 9 March. The reason for the volatility