


NFLX Price Sharply Rose on News of an Increase in the Number of Subscribers
FXOpen

The closing price of NFLX shares yesterday was 490.50, but during after-hours trading, NFLX experienced a sharp increase due to the release of the report. Today, in pre-market trading, NFLX is priced at over 530 dollars per share.
The main surprise contained in the report was the increase in the number of paid subscribers. Analysts expected +8.7 million, but the actual figure was +13 million. The growth in the subscriber base is attributed to:
→ the company offering a lower subscription rate that includes minor advertising inserts;
→ the improvement in the quality of content, including original series, sports broadcasts, games, and shows.
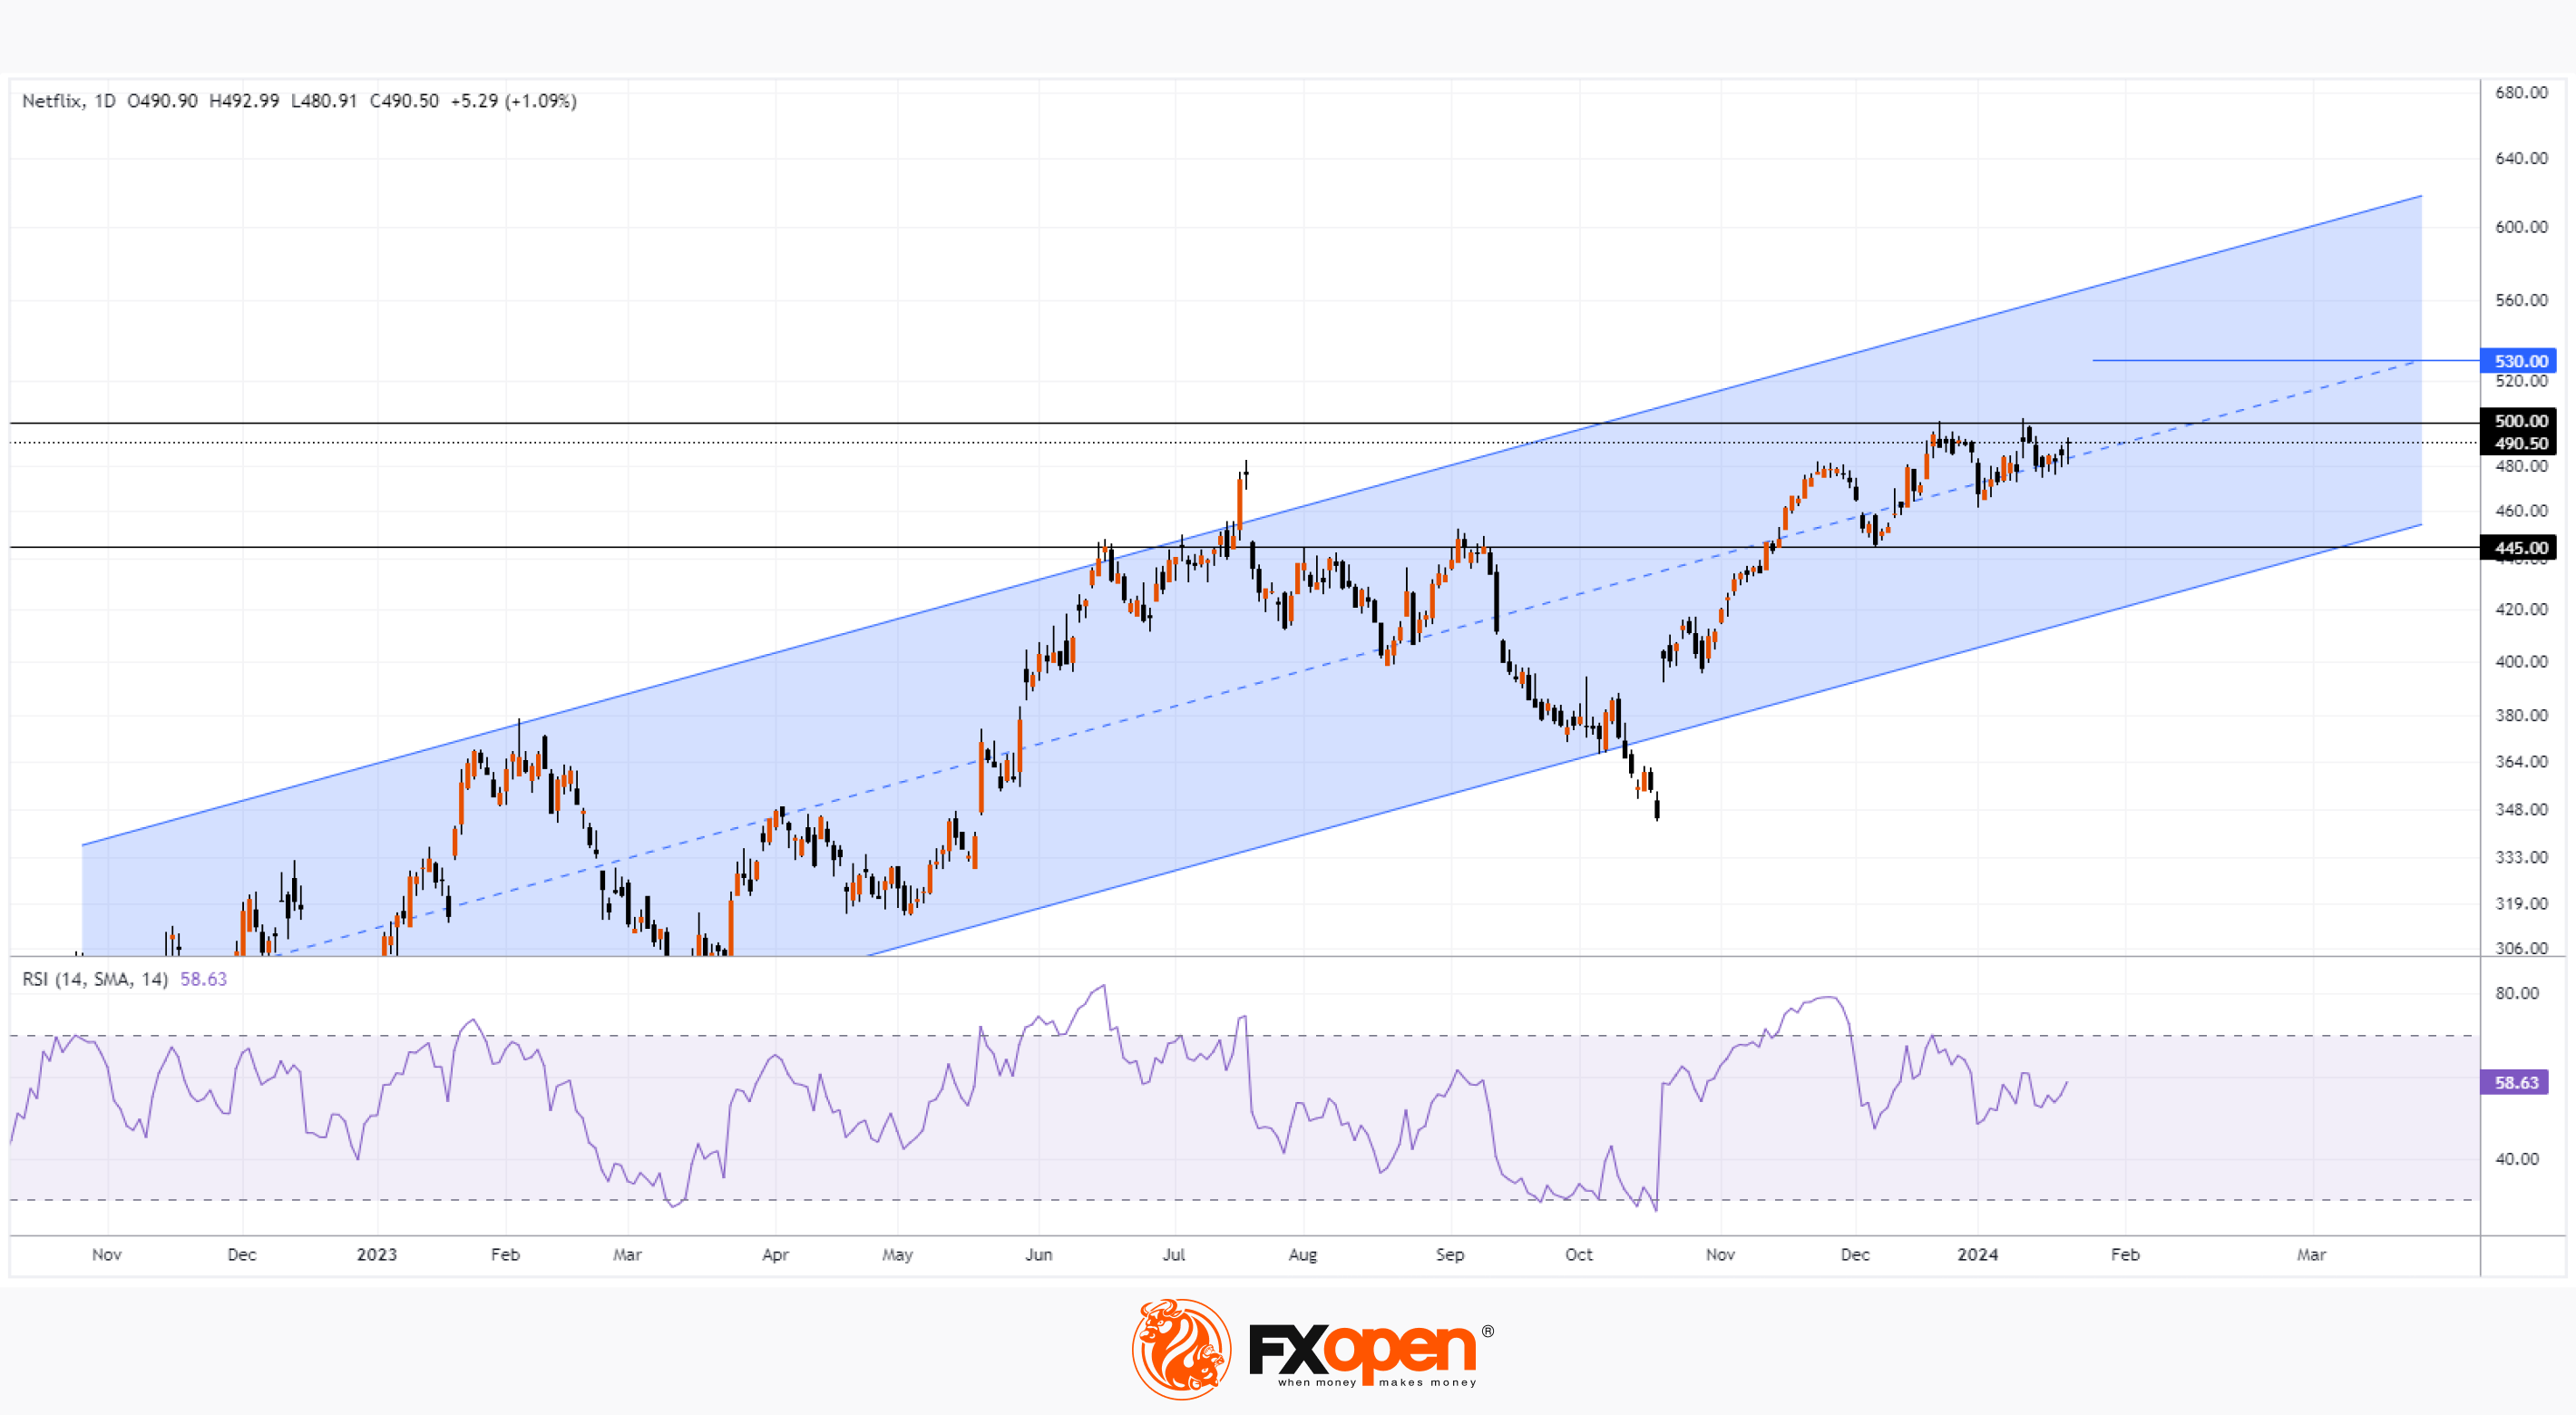
The chart shows that the NFLX share price is developing within an ascending trend (shown by the blue channel). Assuming that the market may open around 530 dollars, then:
→ a bullish gap will form on the chart, which may serve as a broad support zone;
→ the price will surpass the psychological level of 500 dollars per NFLX share. This level, previously demonstrating resistance properties, may now change its role to support – as was the case with the level at 445 dollars.
→ the RSI indicator will show market overbought conditions. A scenario with some correction (e.g., towards the median line of the channel) is not ruled out after the emotions from the company's success subside.
However, overall, the market looks strong, considering the backdrop of the decline in the NFLX price from its historical high of $700 in November 2021 to below $200 in May 2022. We may assume that Netflix has successfully restructured its business model, and if the subscriber base continues to grow at the same pace, the NFLX share price could reach $600 this year.
Buy and sell stocks of the world's biggest publicly-listed companies with CFDs on FXOpen’s trading platform. Open your FXOpen account now or learn more about trading share CFDs with FXOpen.
This article represents the opinion of the Companies operating under the FXOpen brand only. It is not to be construed as an offer, solicitation, or recommendation with respect to products and services provided by the Companies operating under the FXOpen brand, nor is it to be considered financial advice.
Stay ahead of the market!
Subscribe now to our mailing list and receive the latest market news and insights delivered directly to your inbox.


Latest articles

EUR/USD Eyes Gains As USD/CHF Weakness Deepens Again
EUR/USD started a fresh increase above 1.1700 and 1.1720. USD/CHF declined further and is now struggling below 0.7835.
Important Takeaways for EUR/USD and USD/CHF Analysis Today
· The Euro started a decent increase from

Apple: Earnings Day Above the Activity Zone
On 30 April, after the market close, Apple Inc. will release its financial results for the second quarter of fiscal 2026. The consensus forecast, based on estimates from 31 analysts, points to revenue of around $109.7 billion, with expected

USD/JPY and USD/CHF Near Key Levels: The Dollar Supported by the Fed
The US dollar continues to trend upwards following the Federal Reserve meeting, drawing support from the regulator’s moderately hawkish stance and comments by Jerome Powell. Markets interpret the Fed’s rhetoric as a signal that restrictive policy is likely