


NFLX Stock Price Falls Despite Subscriber Growth
FXOpen

Yesterday, after the close of the main trading session on the stock market, Netflix reported to investors for the 1st quarter of 2024.
The report turned out better than expected:
→ earnings per share: actual = USD 5.28, forecast = USD 4.52;
→ gross income: actual = USD 9.40 billion, forecast = USD 9.27.
→ The number of subscribers increased by 9.3 million (expected +4.8 million).
However, NFLX's pre-market share price today is hovering around USD 580, about 6% below yesterday's closing price.
Negativity manifested itself in:
→ disappointing forecasts for the 2nd quarter;
→ investors also did not like the decision to stop providing quarterly reports on changes in the number of subscribers next year.
If NFLX stock opens today around the USD 580 level, then it would indicate that the market has moved down to the lower boundary of the parallel channel (shown in blue).
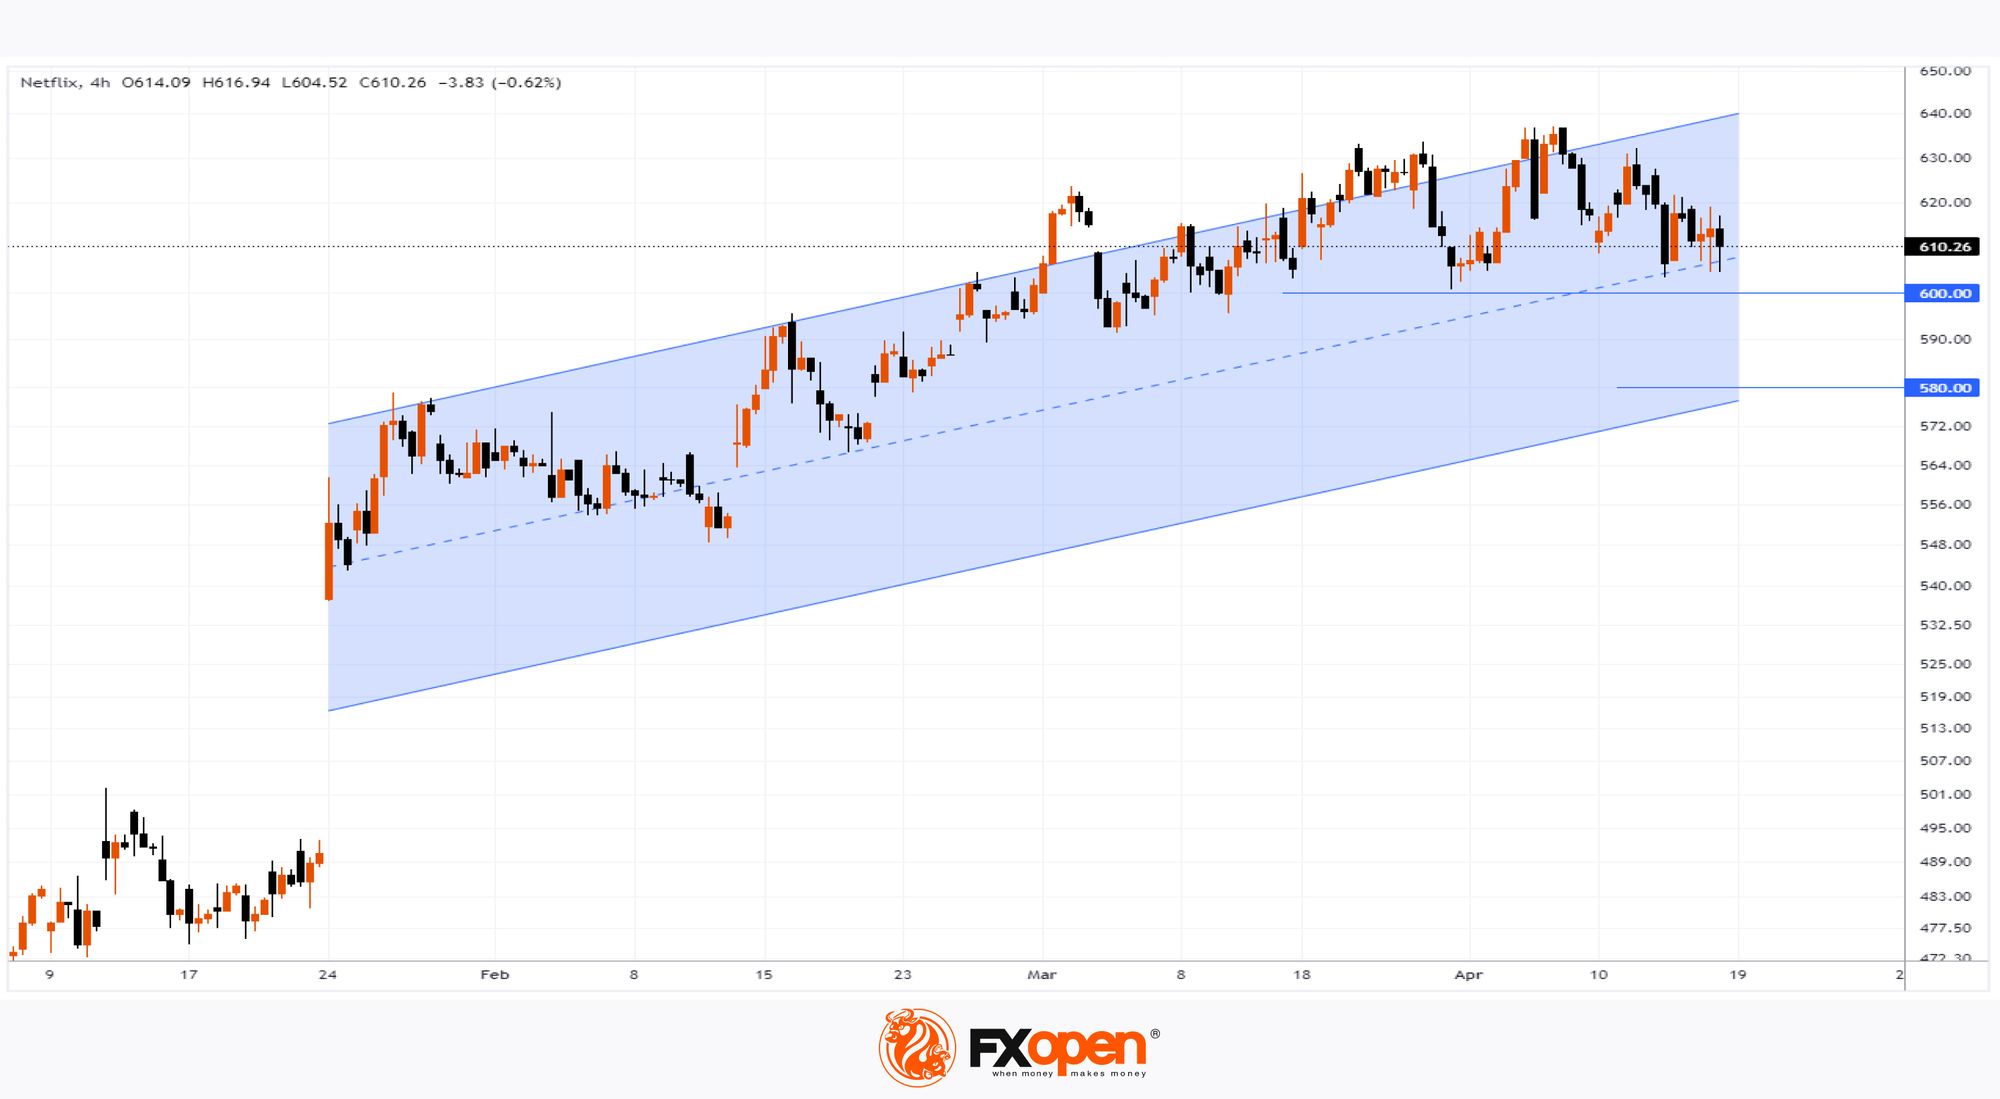
According to the technical analysis of NFLX stock:
→ a bearish gap may form on the chart, which is usually assessed as an obstacle to price growth;
→ the psychological level of USD 600 per NFLX share may act as resistance;
→ rounding pattern (shown by a red arc) – a sign of depletion of demand.
Even if the NFLX stock price forms a bounce from the lower boundary of the channel, bulls will have to contend with the technical hurdles outlined above. And also negative fundamental factors associated with the fact that the Fed will hold interest rates for a longer time.
According to the average consensus of analysts surveyed by TipRanks, the projected 12-month stock price for NFLX stock is USD 637.29.
Buy and sell stocks of the world's biggest publicly-listed companies with CFDs on FXOpen’s trading platform. Open your FXOpen account now or learn more about trading share CFDs with FXOpen.
This article represents the opinion of the Companies operating under the FXOpen brand only. It is not to be construed as an offer, solicitation, or recommendation with respect to products and services provided by the Companies operating under the FXOpen brand, nor is it to be considered financial advice.
Stay ahead of the market!
Subscribe now to our mailing list and receive the latest market news and insights delivered directly to your inbox.


Latest articles

AI Valuations Are Back in the Spotlight
Artificial intelligence remains the dominant investment theme of 2026, but investors are increasingly questioning whether AI stock valuations are keeping pace with reality.
💰 Big Tech continues to invest at an unprecedented scale, with hyperscaler AI spending projected to exceed $800

AUD/CAD: Months of Indecision — Is a Breakout Finally Coming?
The Australian dollar has clawed back most of its end-of-June losses, when it touched three-month lows against the greenback amid escalating Middle East tensions. Since then, sentiment has improved: the RBA's Assistant Governor Sarah Hunter signalled the board stands ready

USD/JPY: Battling at the Top of the Triangle
On 3 July, Japan's Finance Minister, Satsuki Katayama, stated that the Ministry of Finance remains in close contact with US authorities regarding developments in USD/JPY as the yen traded near its weakest level in almost 40 years. Similar verbal