


FXOpen

In mid-October, the Nikkei 225 index (Japan 225 on FXOpen) attempted to breach the psychological barrier of 40,000 points but ultimately failed, reversing its course downwards.
This week, the index has continued its downward trend, driven by concerns surrounding the upcoming elections for Japan's House of Representatives scheduled for October 27. According to Reuters, the ruling Liberal Democratic Party (LDP) and its coalition partner, Komeito, may lose their majority in the elections.
Meanwhile, technical analysis of the Nikkei 225 (Japan 225 on FXOpen) chart reveals several bearish indicators:
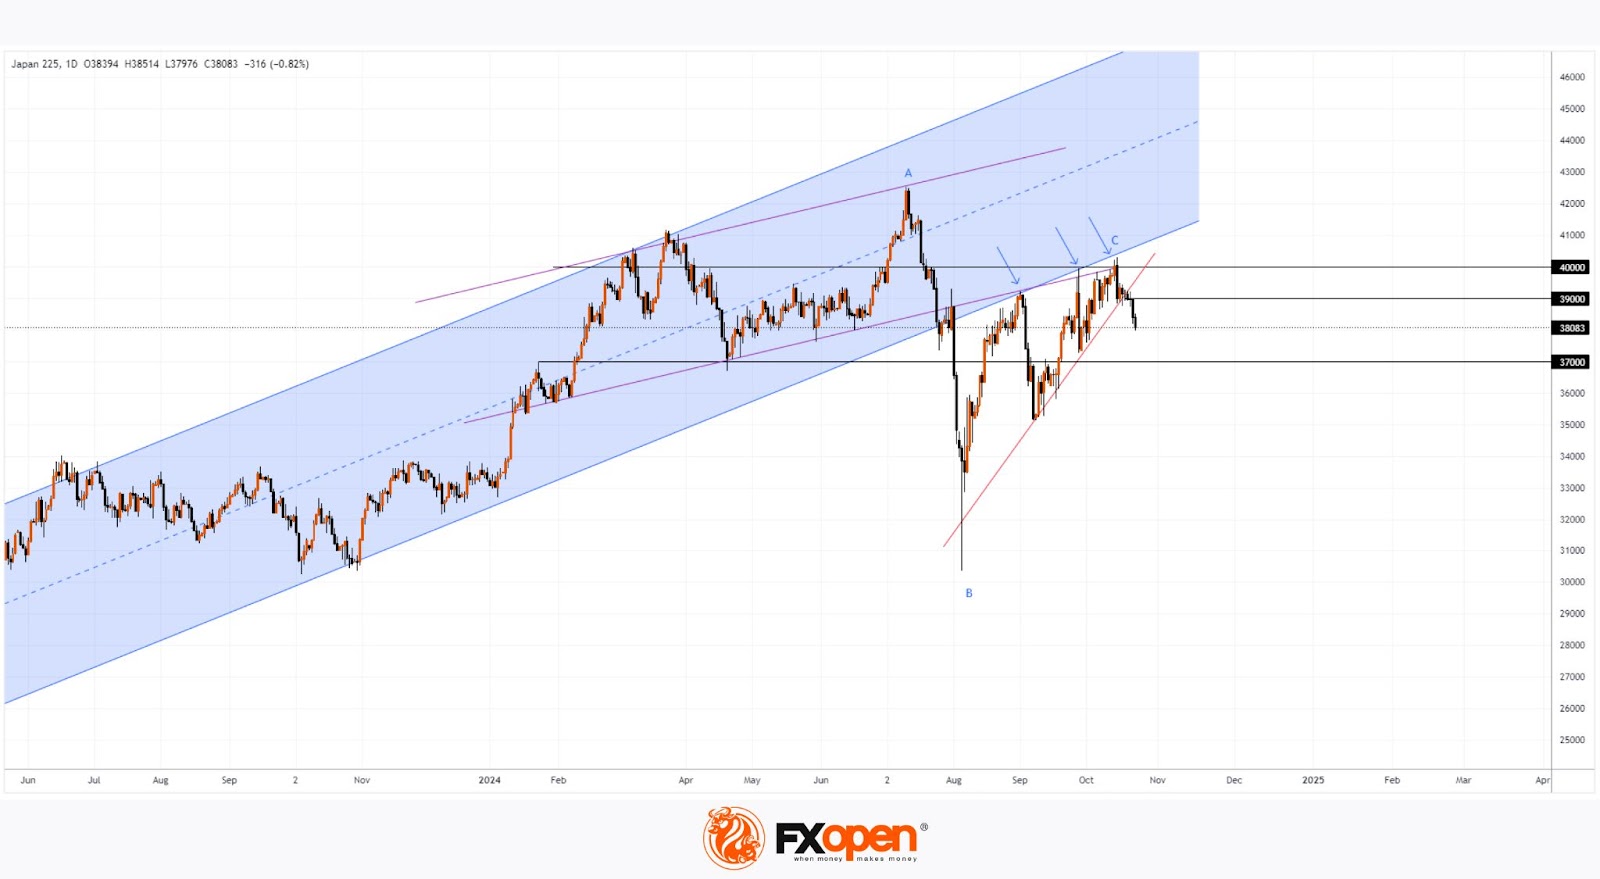
→ The lower bounds of both the previously active blue and purple ascending channels have acted as resistance, along with the noted 40,000 level.
→ The price has broken below the ascending trend line (marked in red) around 39,000, suggesting that bears have gained enough strength to push through. Consequently, the 39,000 level may now serve as resistance.
Overall, the situation appears increasingly concerning. Could the rise from point V to C be merely a corrective move following the downward impulse from A to B? If so, a downward reversal from 40,000, coupled with a bearish breach of the trend line, could signal a resumption of the downtrend, potentially leading to a decline towards the 37,000 level, which has previously interacted with the price on multiple occasions.
Trade global index CFDs with zero commission and tight spreads (additional fees may apply). Open your FXOpen account now or learn more about trading index CFDs with FXOpen.
This article represents the opinion of the Companies operating under the FXOpen brand only. It is not to be construed as an offer, solicitation, or recommendation with respect to products and services provided by the Companies operating under the FXOpen brand, nor is it to be considered financial advice.
Stay ahead of the market!
Subscribe now to our mailing list and receive the latest market news and insights delivered directly to your inbox.


Latest articles

Market Analysis: GBP/USD Dips Further As EUR/GBP Regains Traction
GBP/USD failed to climb above 1.3500 and corrected some gains. EUR/GBP started a decent increase and might aim for more gains above 0.8700.
Important Takeaways for GBP/USD and EUR/GBP Analysis Today
· The British Pound


Market Insights with Gary Thomson: Oil, US Retail Sales & NFP in Focus
In this video, we’ll explore the key economic events and market trends, shaping the financial landscape. Get ready for insights into financial markets to help you navigate the week ahead. Let’s dive in!
In this episode of Market