


FXOpen

As the chart shows, the Nikkei 225 stock index (Japan 225 on FXOpen) formed a historic peak around 52,500 points only yesterday — but today it has fallen sharply, with losses at the session low reaching approximately 7%.
Bearish sentiment was fuelled in part by a slump in shares of Japanese investment giant SoftBank, which dropped by around 14%. The company’s heavy exposure to sectors linked to artificial intelligence and cryptocurrencies, both currently under pressure, has raised investor concerns.
The decline in the Nikkei 225 appears to be an extension of the sell-off in US technology stocks recorded yesterday, driven by a stronger dollar and growing fears of an AI-fuelled bubble.
Technical Analysis of the Nikkei 225 Chart
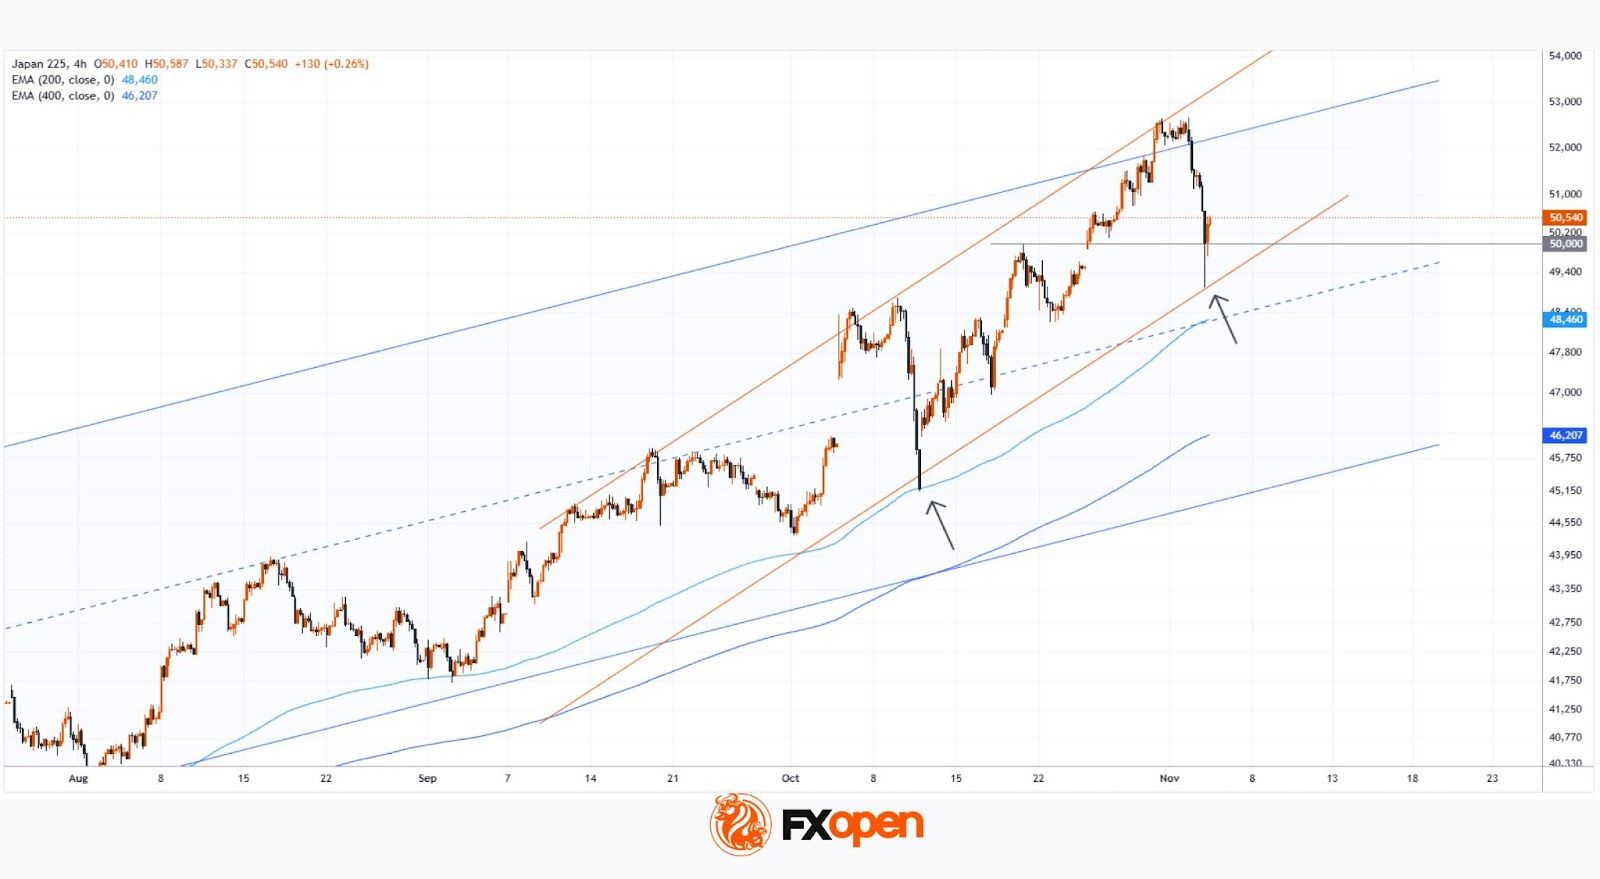
As shown by the 200- and 400-period moving averages on the 4-hour chart, Japan’s equity market remains in a long-term uptrend, with the widening gap between the two lines signalling an acceleration in growth. This supports the relevance of two upward channels:
→ a long-term channel, shown in blue;
→ an intermediate channel, marked by orange lines with a steeper gradient.
It is noteworthy that at the start of November, the Nikkei 225 entered the zone where the upper boundaries of both channels intersect – unsurprisingly, this confluence of resistance lines triggered a wave of selling pressure.
Key observations:
→ Sellers succeeded in pushing the price down towards the lower orange line, which acted as strong support, similar to the movement seen between 10–12 October (indicated by arrows on the chart);
→ Today, the price made a false bearish breakout below the psychological 50,000 level, forming a candle with a long lower shadow – a sign of buying interest.
Given the above, it is reasonable to assume that the market may attempt to resume its upward trajectory. Should this scenario play out, we could see signs of rally exhaustion, as the upward movement that began in April has already lifted the Nikkei 225 by more than 280%.
Trade global index CFDs with zero commission and tight spreads (additional fees may apply). Open your FXOpen account now or learn more about trading index CFDs with FXOpen.
This article represents the opinion of the Companies operating under the FXOpen brand only. It is not to be construed as an offer, solicitation, or recommendation with respect to products and services provided by the Companies operating under the FXOpen brand, nor is it to be considered financial advice.
Stay ahead of the market!
Subscribe now to our mailing list and receive the latest market news and insights delivered directly to your inbox.


Latest articles

FX Markets Are Changing: What’s Driving Currencies Now?
FX markets have become increasingly reactive in March, with geopolitical developments—particularly the US–Iran conflict—driving price action across currencies, commodities, and interest rate expectations.
In this update, we examine the key forces shaping the FX market right now,

GBP/USD Rises Following Bank of England Decision
Yesterday, the Bank of England’s decision had a significant impact on the pound, which strengthened against other currencies. Although the Official Bank Rate remained unchanged at 3.75%, the market was surprised by the “hawkish” signals, which sharply contrasted

S&P 500 Analysis: Index Falls to Year-to-Date Low
As the S&P 500 chart (US SPX 500 mini on FXOpen) shows, the index dropped below the 6,570 level yesterday for the first time in 2026. As a result, the equity market may be on track to