


FXOpen

As the chart shows, this morning the Nikkei 225 price exceeded 35,700, its highest level in decades.
The Nikkei 225 index reached its all-time high on December 30, 1989, at 38,957.44 points. This was against the backdrop of Japan's economic boom, which began in the 1980s and continued until the early 1990s.
Nikkei 225 growth is supported by lower inflation:
→ in Japan: the latest data showed an annual inflation rate of 2.8% — lower than a series of more than 10 previous values, all of which were above 3%. This reduces fears that the Bank of Japan will raise interest rates and limit its current economic stimulus policies.
→ In the USA. Today, we remind you that at 16:30 GMT+3 inflation data in the USA will be published. It is also expected to show a slowdown in inflation. Therefore, market participants believe in a reduction in Fed rates, which can give impetus to the development of companies.
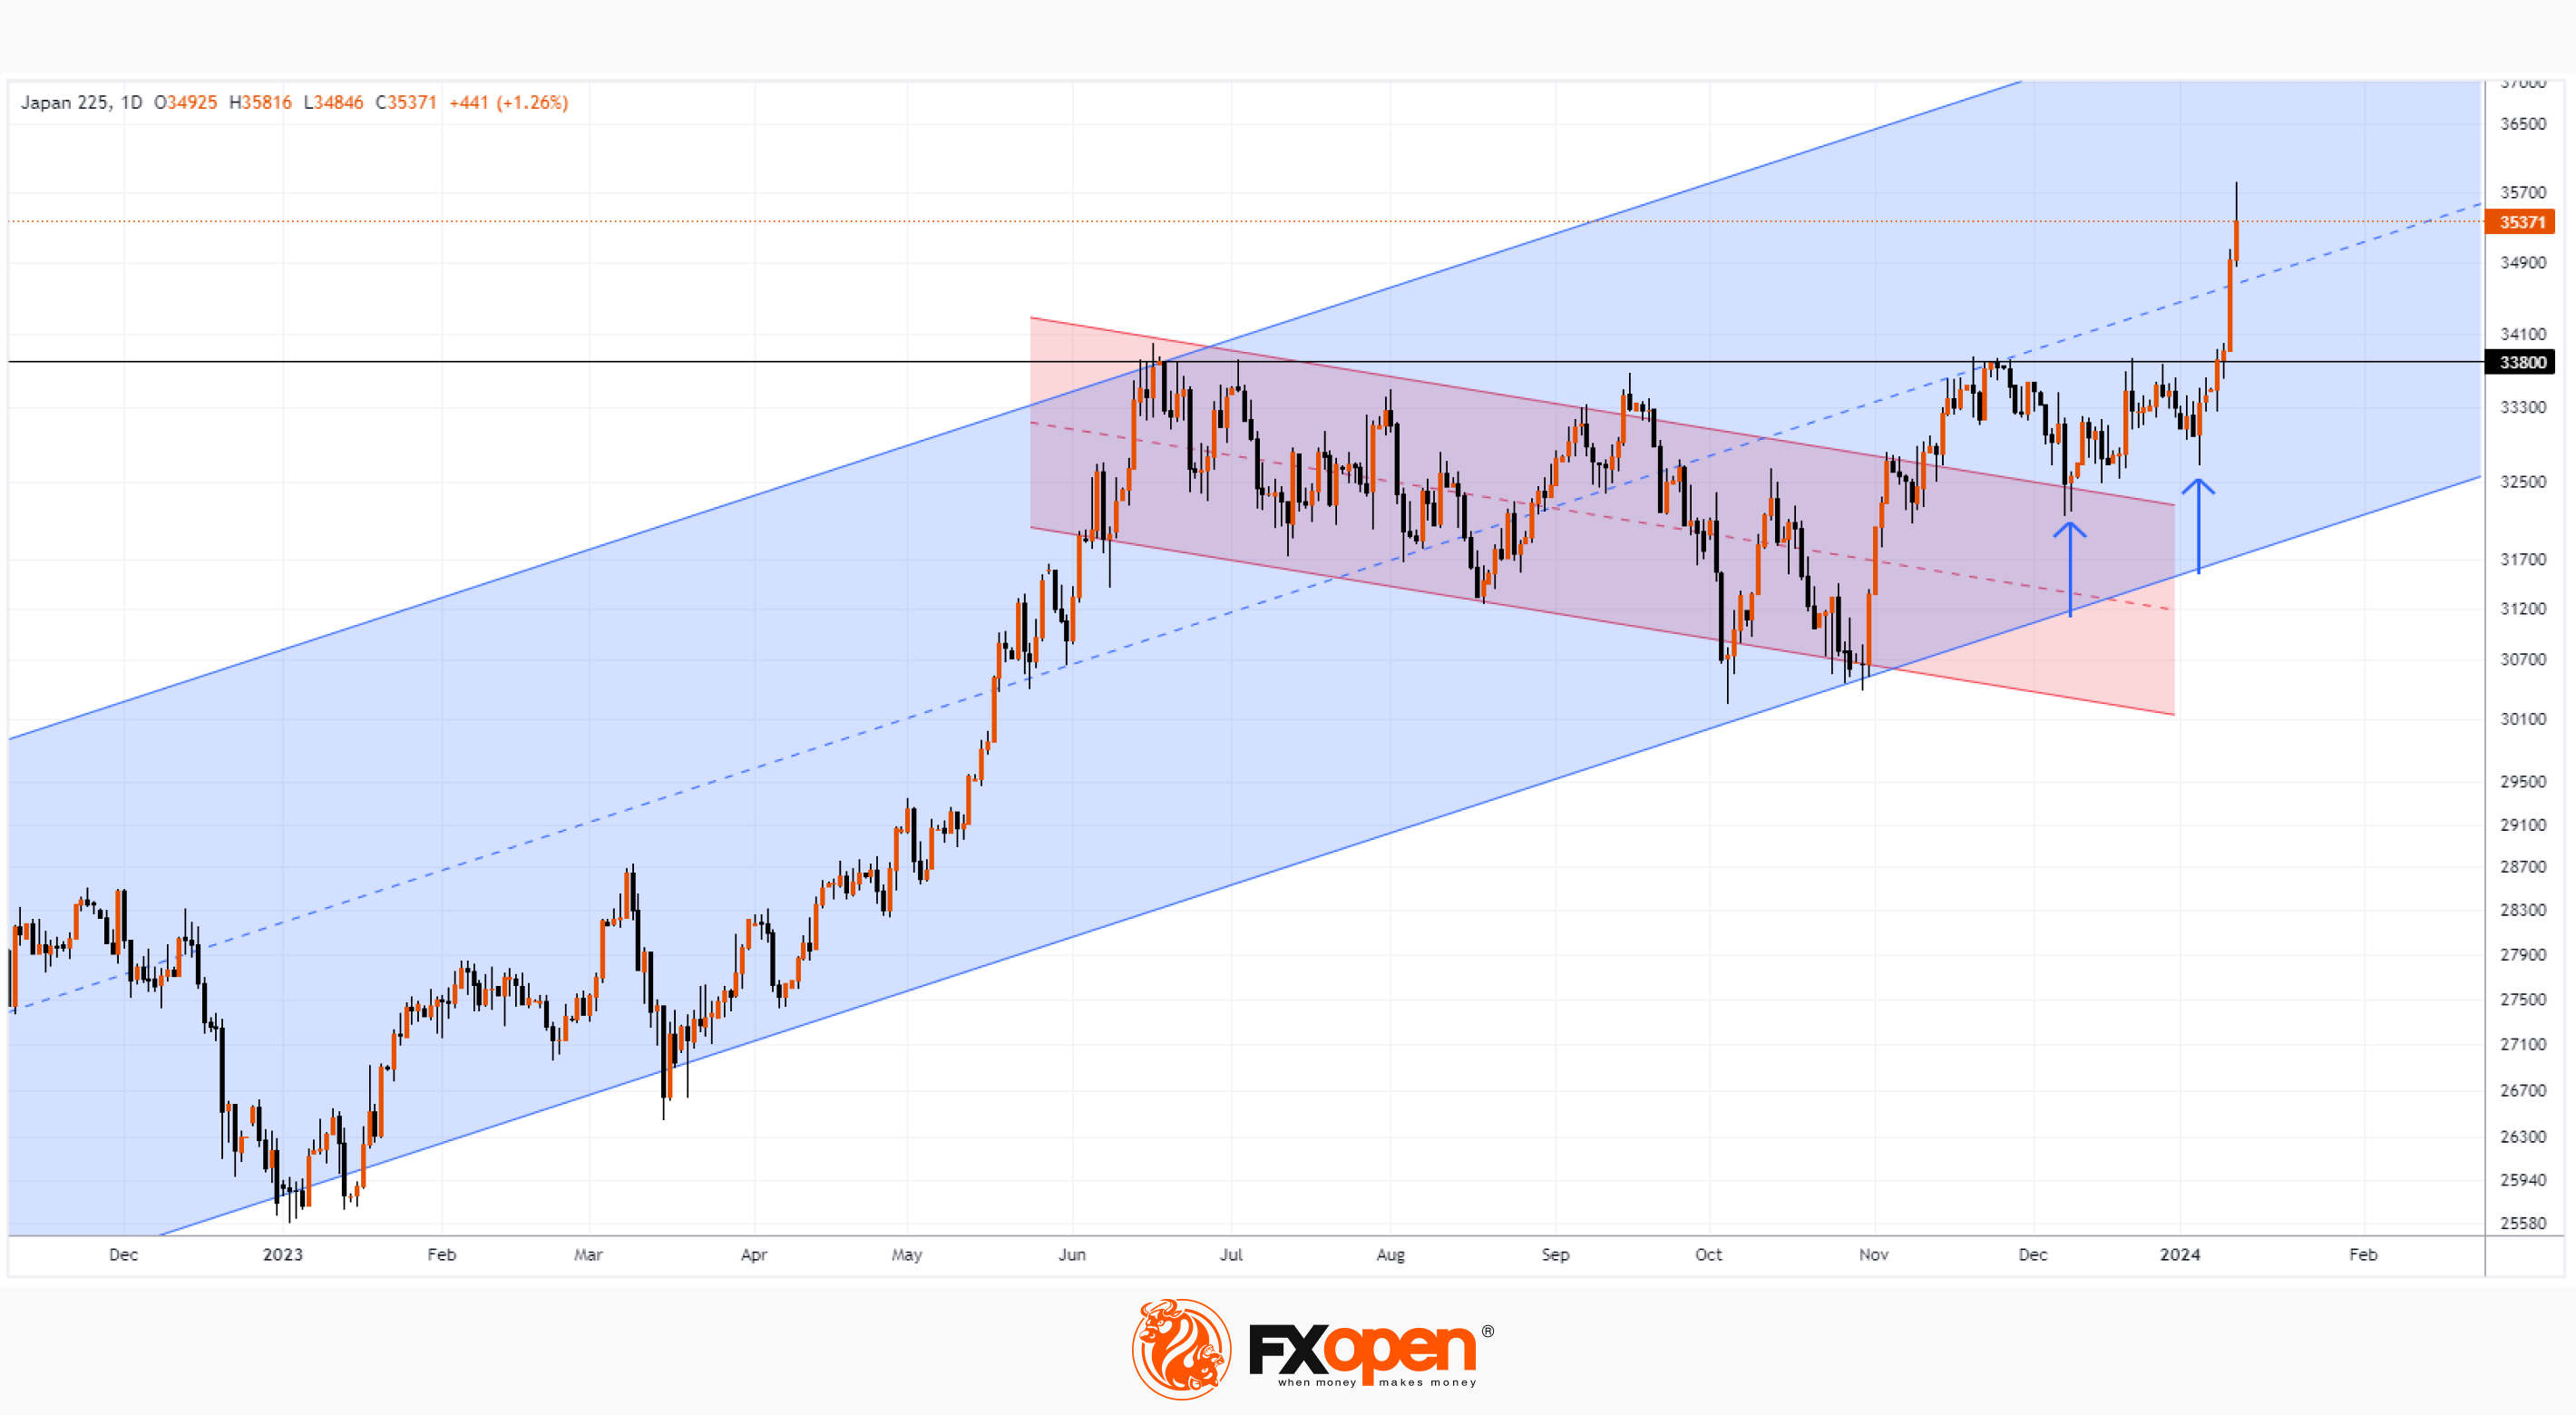
The NIKKEI chart shows that:
→ the price is in an upward trend (marked by a blue channel);
→ the price has overcome the correction period (marked by a red channel), which can be interpreted as a flag figure;
→ on December 7, the price tested the upper border of the flag (shown by the first arrow);
→ on January 4, the price formed a higher low (shown by the second arrow);
→ has overcome the median line of the channel (blue dotted line).
Indicators show overbought, the long upper shadow on the last candle indicates that the bears are activating, so a pullback should not come as a surprise. The median line could help the bulls consolidate their progress, and the 33,800 level should now be regarded as important support.
Trade global index CFDs with zero commission and tight spreads (additional fees may apply). Open your FXOpen account now or learn more about trading index CFDs with FXOpen.
This article represents the opinion of the Companies operating under the FXOpen brand only. It is not to be construed as an offer, solicitation, or recommendation with respect to products and services provided by the Companies operating under the FXOpen brand, nor is it to be considered financial advice.
Stay ahead of the market!
Subscribe now to our mailing list and receive the latest market news and insights delivered directly to your inbox.


Latest articles

FX Markets Are Changing: What’s Driving Currencies Now?
FX markets have become increasingly reactive in March, with geopolitical developments—particularly the US–Iran conflict—driving price action across currencies, commodities, and interest rate expectations.
In this update, we examine the key forces shaping the FX market right now,

GBP/USD Rises Following Bank of England Decision
Yesterday, the Bank of England’s decision had a significant impact on the pound, which strengthened against other currencies. Although the Official Bank Rate remained unchanged at 3.75%, the market was surprised by the “hawkish” signals, which sharply contrasted

S&P 500 Analysis: Index Falls to Year-to-Date Low
As the S&P 500 chart (US SPX 500 mini on FXOpen) shows, the index dropped below the 6,570 level yesterday for the first time in 2026. As a result, the equity market may be on track to