


FXOpen

The Nikkei 225 (Japan 225 on FXOpen) has risen nearly 20% in 2024, marking its best performance since 1989, according to Trading Economics. This impressive gain is especially noteworthy considering the market plunge in early August, triggered partly by the Bank of Japan’s historic interest rate hike.
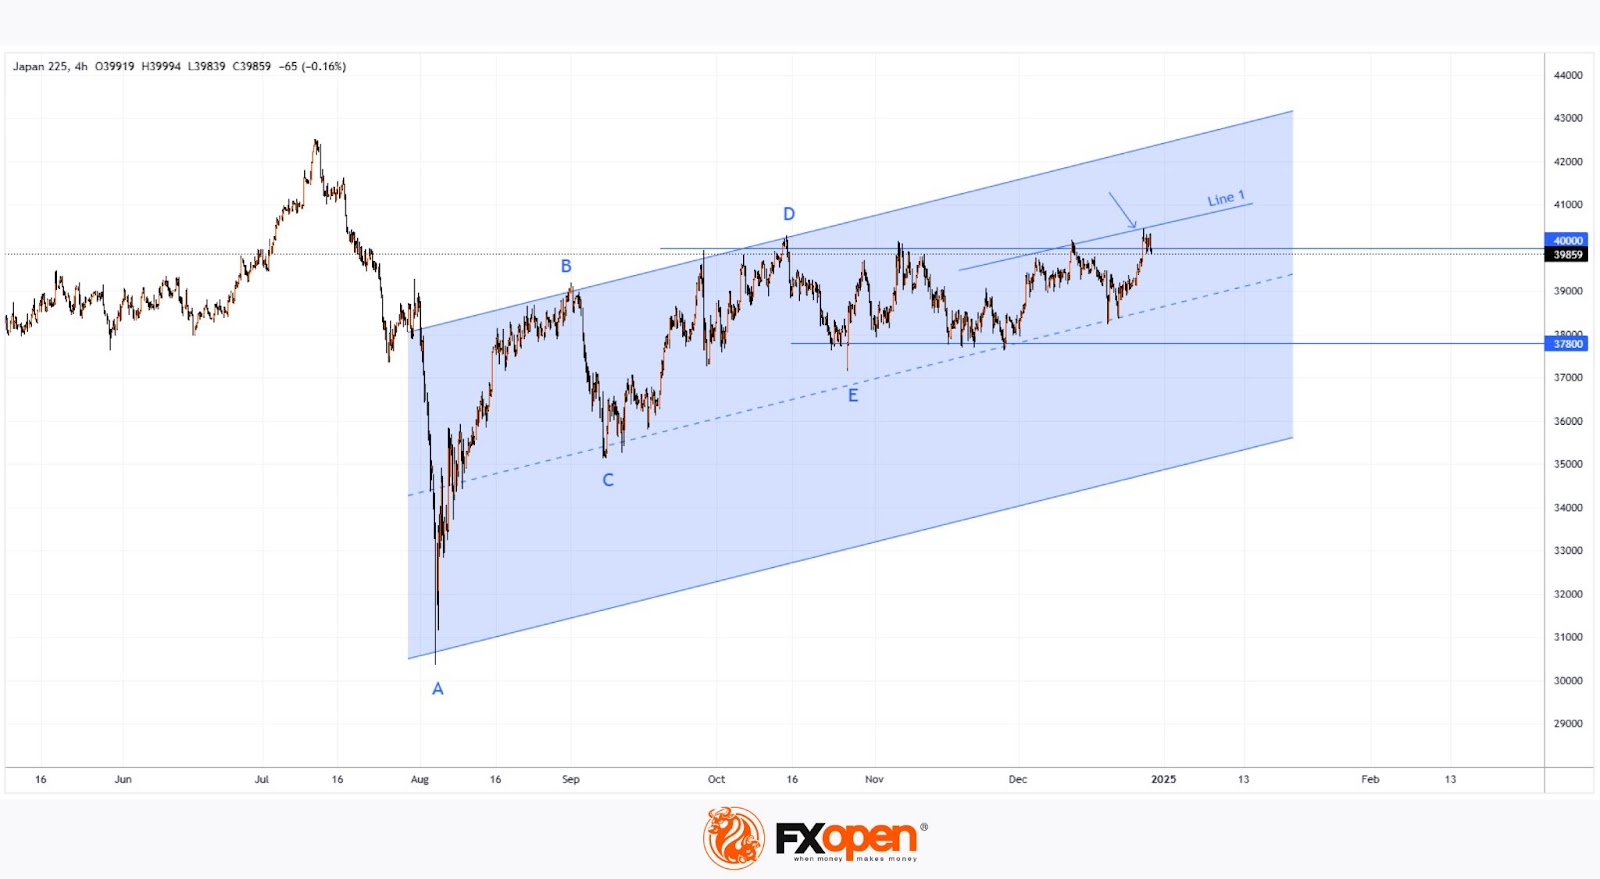
According to today's chart of the Japanese stock market index Nikkei 225 (Japan 225 on FXOpen):
→ Late last week (marked with an arrow), the index surpassed the psychological 40,000 level, reaching a 5-month high.
→ However, as this week began, the Nikkei 225 dropped below 40,000, failing to sustain its position above this key level.
Potential influencing factors:
→ Portfolio adjustments as the new year begins.
→ News about a potential merger between Nissan and Honda.
→ A weakening yen, which supports Japan’s export-driven industries.
Technical analysis of the Japan 225 (Japan 225 on FXOpen) chart shows that:
→ Bulls have been forming an A-B-C-D-E structure of higher highs, outlining an ascending channel (shown in blue). Despite this, the 40,000 level remains a strong resistance point.
→ The bears are gaining an edge with Line 1, which splits the channel into quarters and signals increasing resistance.
Given these dynamics, Friday’s peak could be a false bullish breakout. The Nikkei 225 (Japan 225 on FXOpen) might retreat towards the median line or drop further to test support around 37,800.
Trade global index CFDs with zero commission and tight spreads (additional fees may apply). Open your FXOpen account now or learn more about trading index CFDs with FXOpen.
This article represents the opinion of the Companies operating under the FXOpen brand only. It is not to be construed as an offer, solicitation, or recommendation with respect to products and services provided by the Companies operating under the FXOpen brand, nor is it to be considered financial advice.
Stay ahead of the market!
Subscribe now to our mailing list and receive the latest market news and insights delivered directly to your inbox.


Latest articles

NVDA Shares Approach Key Resistance
Nvidia’s chip production is concentrated with Taiwanese contractor TSMC, increasing the company’s exposure to geopolitical risks and US export policy. Restrictions on shipments to China, including decisions related to H20-series chips, have led to significant financial adjustments, which

EUR/USD and GBP/USD at Range Boundaries Ahead of Geopolitical Decisions
European currencies are entering a consolidation phase following an attempted recovery, while market participants adopt a wait-and-see approach amid uncertainty surrounding the geopolitical landscape. Current price action reflects a balance between a softer US dollar and a lack of sustained

Market Analysis: Gold Price Slips Back, WTI Crude Oil Rally Gains Fresh Strength
Gold price rallied above $4,750 before correcting lower. Crude oil prices are rising and could climb further higher toward $110.00.
Important Takeaways for Gold and WTI Crude Oil Prices Analysis Today
· Gold price gained pace for a move