


Nikkei 225 Struggles to Hold Above the Psychological Level
FXOpen

The Nikkei 225 (Japan 225 on FXOpen) has risen nearly 20% in 2024, marking its best performance since 1989, according to Trading Economics. This impressive gain is especially noteworthy considering the market plunge in early August, triggered partly by the Bank of Japan’s historic interest rate hike.
According to today's chart of the Japanese stock market index Nikkei 225 (Japan 225 on FXOpen):
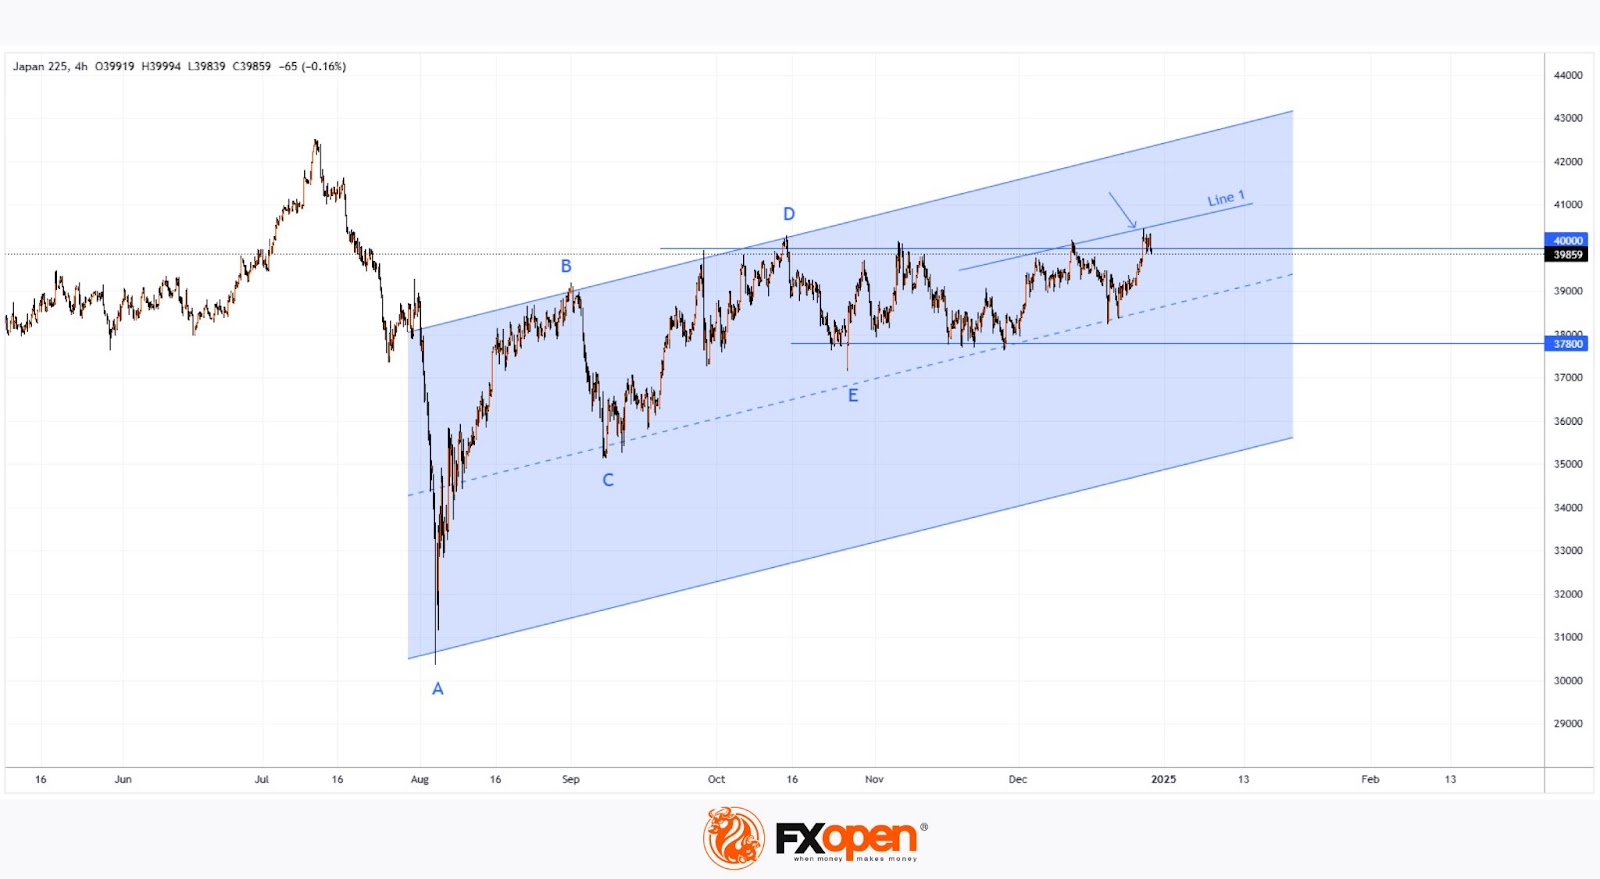
→ Late last week (marked with an arrow), the index surpassed the psychological 40,000 level, reaching a 5-month high.
→ However, as this week began, the Nikkei 225 dropped below 40,000, failing to sustain its position above this key level.
Potential influencing factors:
→ Portfolio adjustments as the new year begins.
→ News about a potential merger between Nissan and Honda.
→ A weakening yen, which supports Japan’s export-driven industries.
Technical analysis of the Japan 225 (Japan 225 on FXOpen) chart shows that:
→ Bulls have been forming an A-B-C-D-E structure of higher highs, outlining an ascending channel (shown in blue). Despite this, the 40,000 level remains a strong resistance point.
→ The bears are gaining an edge with Line 1, which splits the channel into quarters and signals increasing resistance.
Given these dynamics, Friday’s peak could be a false bullish breakout. The Nikkei 225 (Japan 225 on FXOpen) might retreat towards the median line or drop further to test support around 37,800.
Trade global index CFDs with zero commission and tight spreads (additional fees may apply). Open your FXOpen account now or learn more about trading index CFDs with FXOpen.
This article represents the opinion of the Companies operating under the FXOpen brand only. It is not to be construed as an offer, solicitation, or recommendation with respect to products and services provided by the Companies operating under the FXOpen brand, nor is it to be considered financial advice.
Stay ahead of the market!
Subscribe now to our mailing list and receive the latest market news and insights delivered directly to your inbox.


Latest articles

US Dollar Index: A Defining Week for the King of the Markets
The dollar heads into a pivotal week trading near 101.80, just off a 15-month high, with the Fed's July 29 meeting standing as the clear focal point. Markets currently price roughly a 65% chance of a hold, though renewed

NZD/USD: Inflation Surge Meets Strong US Dollar Pressure
On 21 July, Stats NZ reported an acceleration in inflation: the Consumer Price Index rose 1.5% in the second quarter, while the annual inflation rate climbed to 4.1%, its highest level in more than two years and slightly

Weekly Market Insights with Gary Thomson: The Week of Central Banks and Earnings
In this video, we’ll explore the key economic events and market trends, shaping the financial landscape. Get ready for insights into financial markets to help you navigate the week ahead. Let’s dive in!
In this episode of Market