


Nikkei Index Falls Below 38,000 Points This Month for First Time
FXOpen

According to today's Nikkei 225 (Japan 225 on FXOpen) chart, the index quote dropped below 38,000 points at Monday's low, followed by a recovery (shown by an arrow).
One of the drivers of the decline was the automotive sector, whose shares led during the downturn. In particular, according to Reuters, Toyota Motors' shares fell by more than 2% as the company faces difficulties due to a certification scandal. Japanese national broadcaster NHK reported that Toyota will extend the production halt for some models until the end of July.
The fact that the Nikkei 225 (Japan 225 on FXOpen) price is recovering after dropping below the 38,000 mark suggests a false bearish breakout below this psychological level.
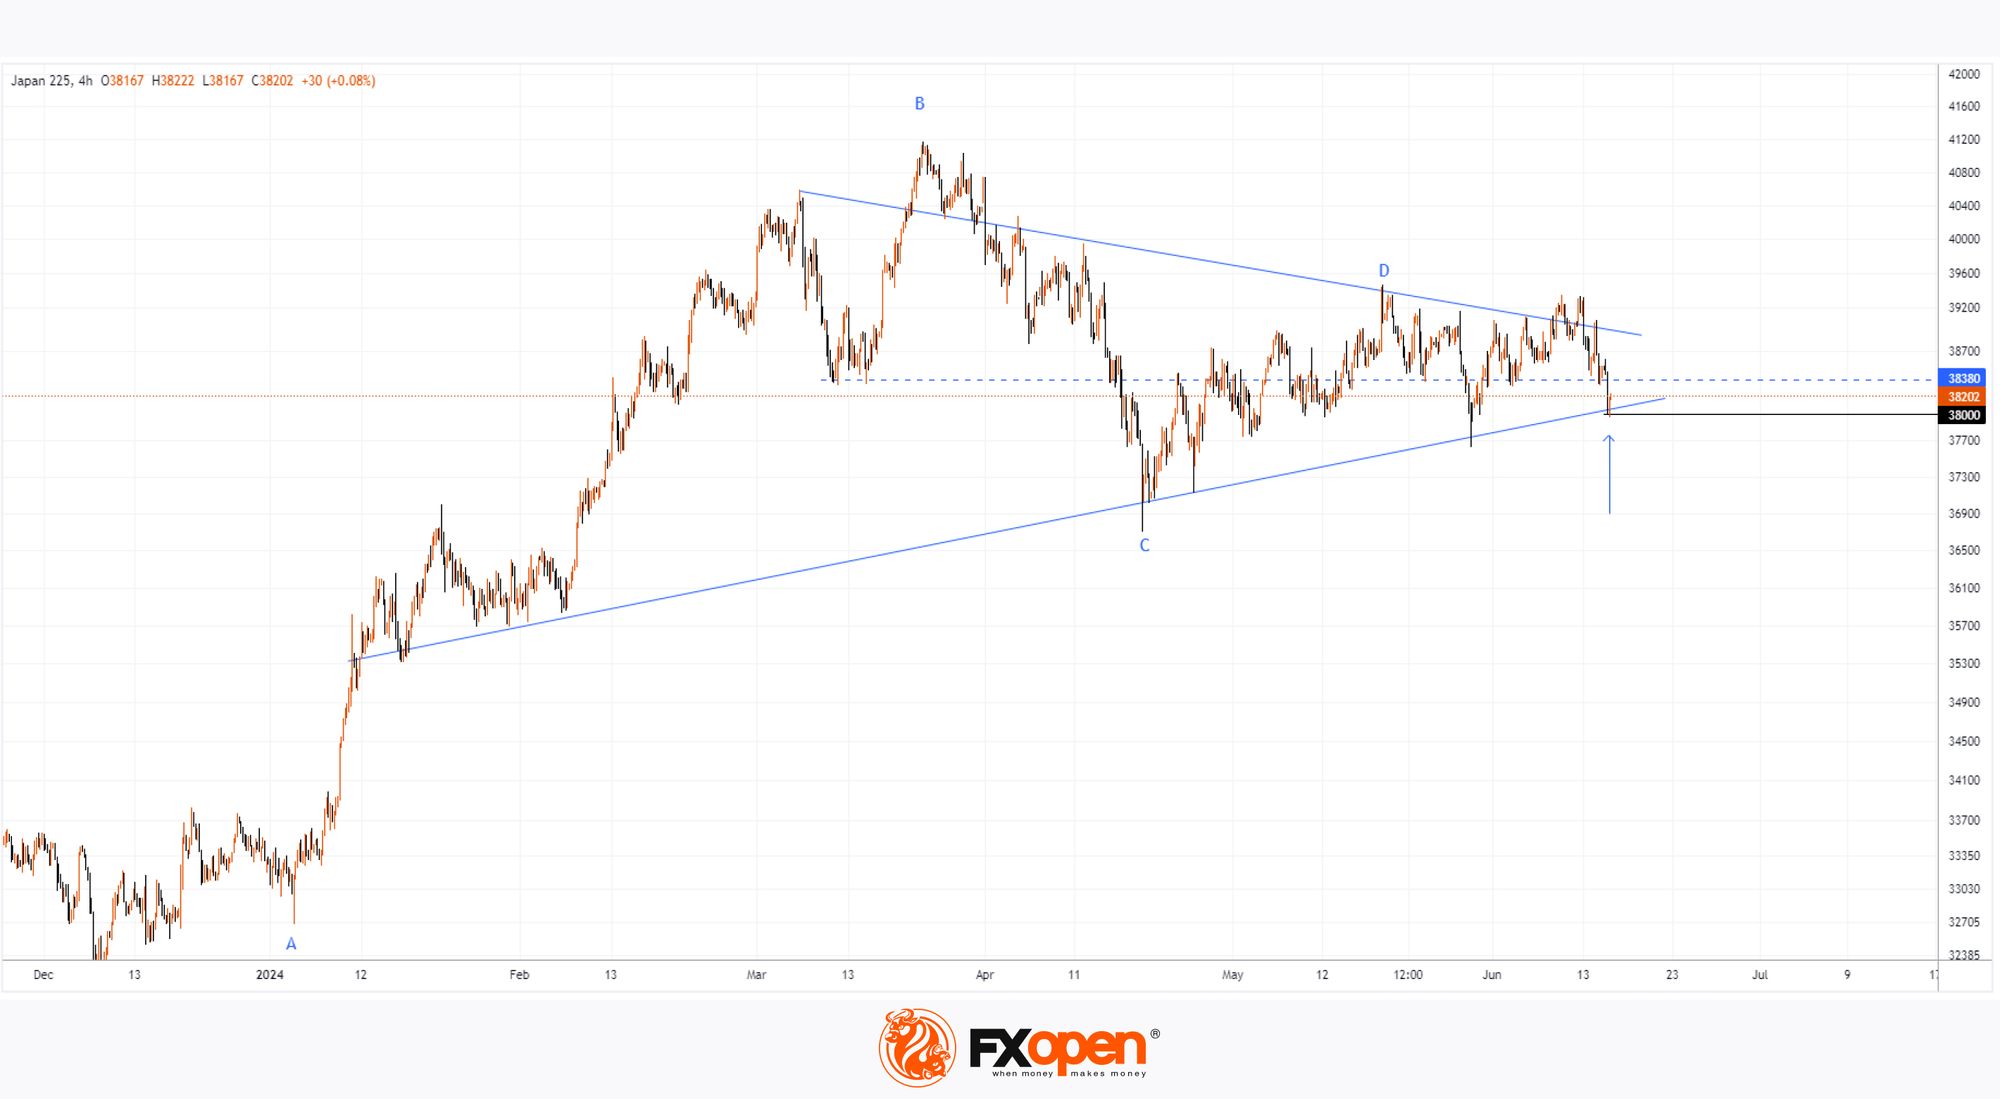
Technical analysis of the Nikkei 225 (Japan 225 on FXOpen) chart provides more insight into market dynamics:
→ Since the beginning of 2024, there has been a sharp rise from point A to point B by more than 20%;
→ This was followed by a retracement to point C, which constituted a Fibonacci 0.500 proportion of the A→B impulse;
→ Then there was a rise from C to D, forming a Fibonacci 0.382 proportion of the B→C impulse.
Thus, in the first half of the year, there has been a series of diminishing oscillations forming a triangle pattern, indicating a balance between demand and supply around the 38,380 axis.
Today's potential bullish reversal (which is not yet fully formed) could confirm the relevance of the triangle's lower boundary and direct the price towards its axis.
It is worth noting that the triangle boundaries are narrowing, and a possible imminent breakout of this graphical pattern, formed in the first half of 2024, could lead to the establishment of a noticeable trend.
Trade global index CFDs with zero commission and tight spreads (additional fees may apply). Open your FXOpen account now or learn more about trading index CFDs with FXOpen.
This article represents the opinion of the Companies operating under the FXOpen brand only. It is not to be construed as an offer, solicitation, or recommendation with respect to products and services provided by the Companies operating under the FXOpen brand, nor is it to be considered financial advice.
Stay ahead of the market!
Subscribe now to our mailing list and receive the latest market news and insights delivered directly to your inbox.


Latest articles

AI Valuations Are Back in the Spotlight
Artificial intelligence remains the dominant investment theme of 2026, but investors are increasingly questioning whether AI stock valuations are keeping pace with reality.
💰 Big Tech continues to invest at an unprecedented scale, with hyperscaler AI spending projected to exceed $800

AUD/CAD: Months of Indecision — Is a Breakout Finally Coming?
The Australian dollar has clawed back most of its end-of-June losses, when it touched three-month lows against the greenback amid escalating Middle East tensions. Since then, sentiment has improved: the RBA's Assistant Governor Sarah Hunter signalled the board stands ready

USD/JPY: Battling at the Top of the Triangle
On 3 July, Japan's Finance Minister, Satsuki Katayama, stated that the Ministry of Finance remains in close contact with US authorities regarding developments in USD/JPY as the yen traded near its weakest level in almost 40 years. Similar verbal