


FXOpen

As evidenced by the NIO stock price chart, yesterday's trading closed at $4.93, while today the NIO share price is around $5.40, indicating an increase of over 9%.
According to MarketWatch, the rise is driven by expectations that the Chinese electric vehicle manufacturer's deliveries are likely to reach record levels.
The existing record was set in July last year when the company achieved monthly sales of 20,462 cars. However, analysts believe this result could be surpassed in May this year due to ongoing discounts on new cars and batteries.
The daily chart of NIO shares today shows that the price is in a long-term downtrend (indicated by the red trend channel) due to the global decline in demand for electric vehicles.
However, there are fundamental reasons to expect that the downward trend will be broken:
→ China is intensifying its efforts to develop electric vehicles – the State Council has presented an action plan for decarbonisation.
→ This month, the International Monetary Fund raised its forecast for China's economic growth in 2024 from 4.6% to 5%.
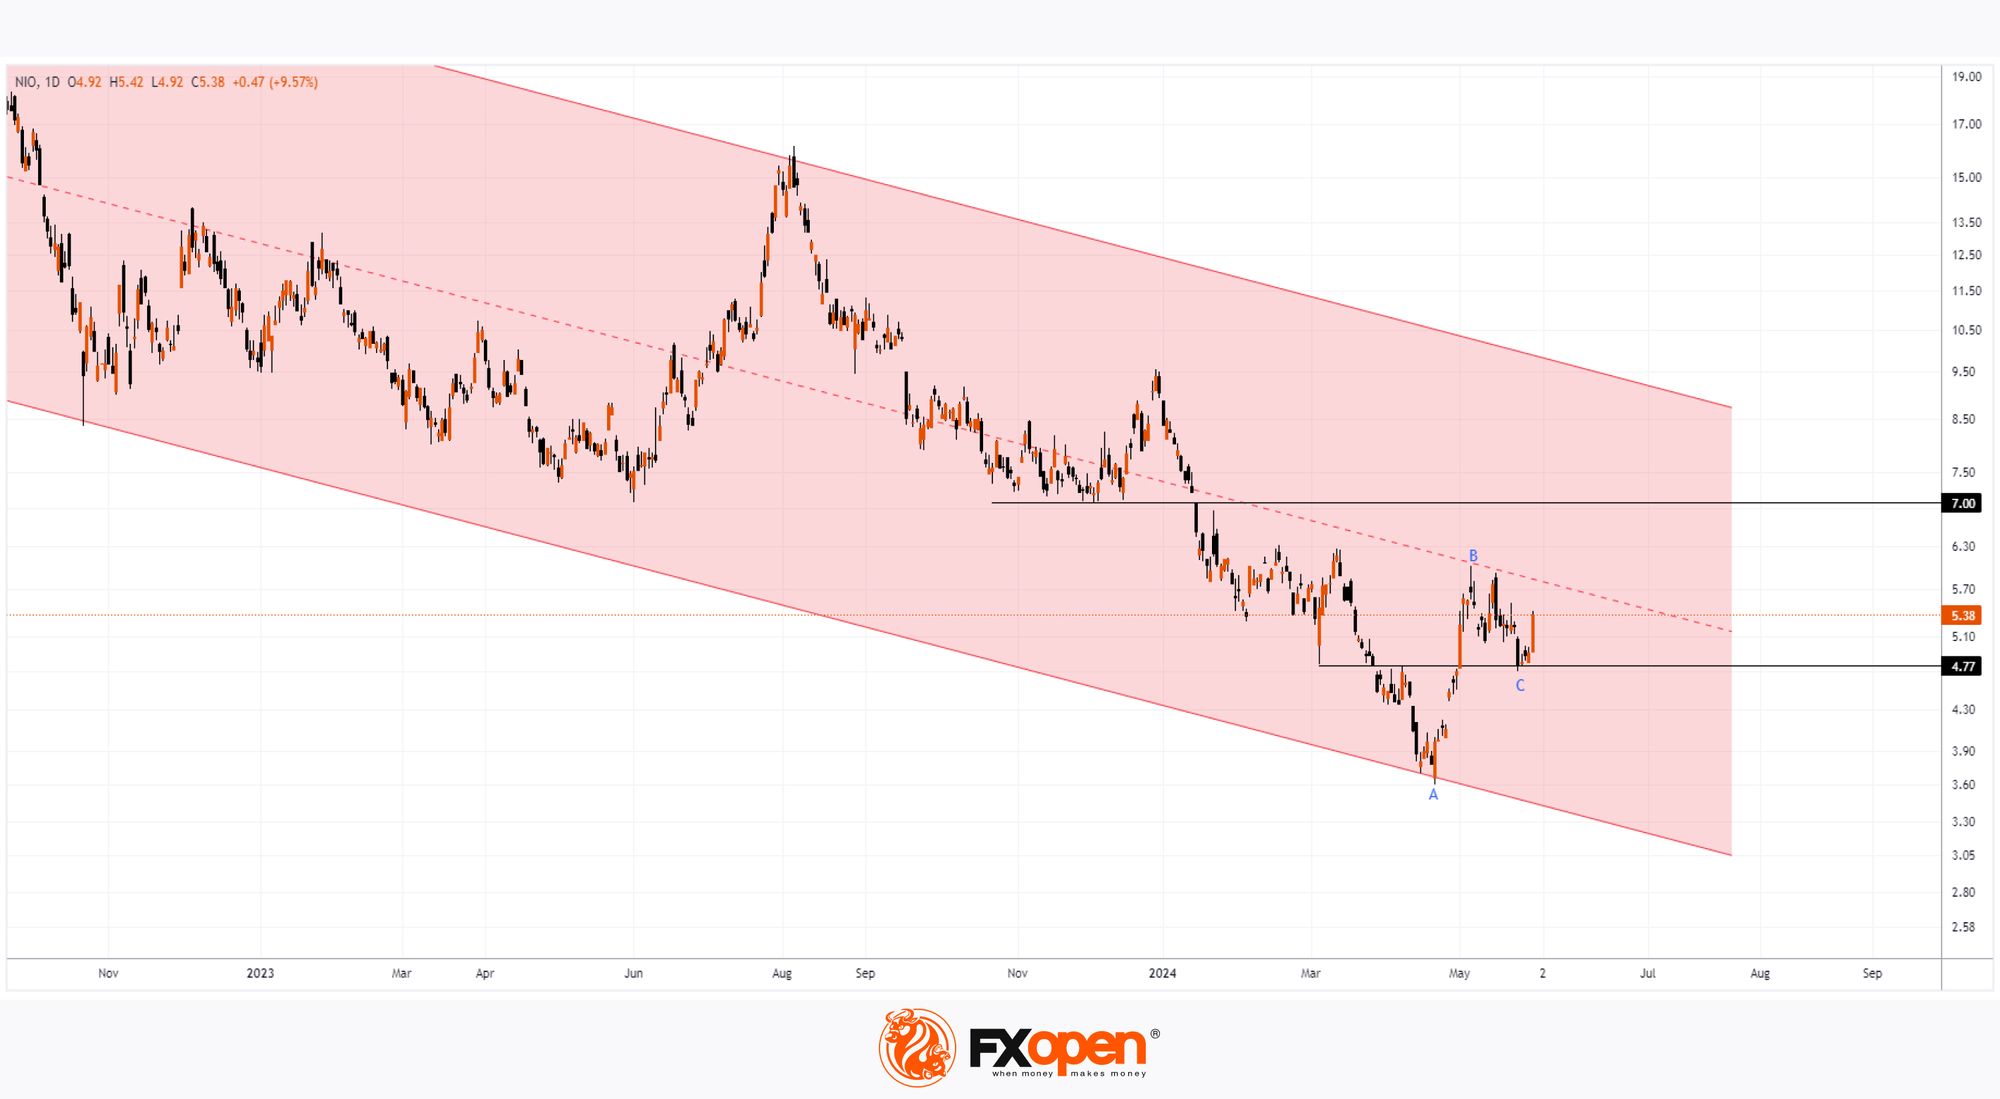
Technical analysis of the NIO stock chart shows that:
→ The price is in a downtrend and below the median line, which can be expected to provide resistance.
→ Resistance may also be encountered at the $7 per share level, which acted as support at the end of 2023.
→ The $4.77 level has changed its role several times but has provided support over the past 10 days, giving the bulls a foothold.
→ The minimum C is at the 50% level of the A→B impulse, which is a sign of a bull market.
On June 6, NIO will present its report for the first quarter of 2024. If the report is strong, it could give the bulls more confidence and lead to attempts to reverse the long-term downtrend.
Buy and sell stocks of the world's biggest publicly-listed companies with CFDs on FXOpen’s trading platform. Open your FXOpen account now or learn more about trading share CFDs with FXOpen.
This article represents the opinion of the Companies operating under the FXOpen brand only. It is not to be construed as an offer, solicitation, or recommendation with respect to products and services provided by the Companies operating under the FXOpen brand, nor is it to be considered financial advice.
Stay ahead of the market!
Subscribe now to our mailing list and receive the latest market news and insights delivered directly to your inbox.


Latest articles

Market Analysis: GBP/USD Dips Further As EUR/GBP Regains Traction
GBP/USD failed to climb above 1.3500 and corrected some gains. EUR/GBP started a decent increase and might aim for more gains above 0.8700.
Important Takeaways for GBP/USD and EUR/GBP Analysis Today
· The British Pound


Market Insights with Gary Thomson: Oil, US Retail Sales & NFP in Focus
In this video, we’ll explore the key economic events and market trends, shaping the financial landscape. Get ready for insights into financial markets to help you navigate the week ahead. Let’s dive in!
In this episode of Market