


NIO Shares Surged Over 9% on Sales Growth Expectations
FXOpen
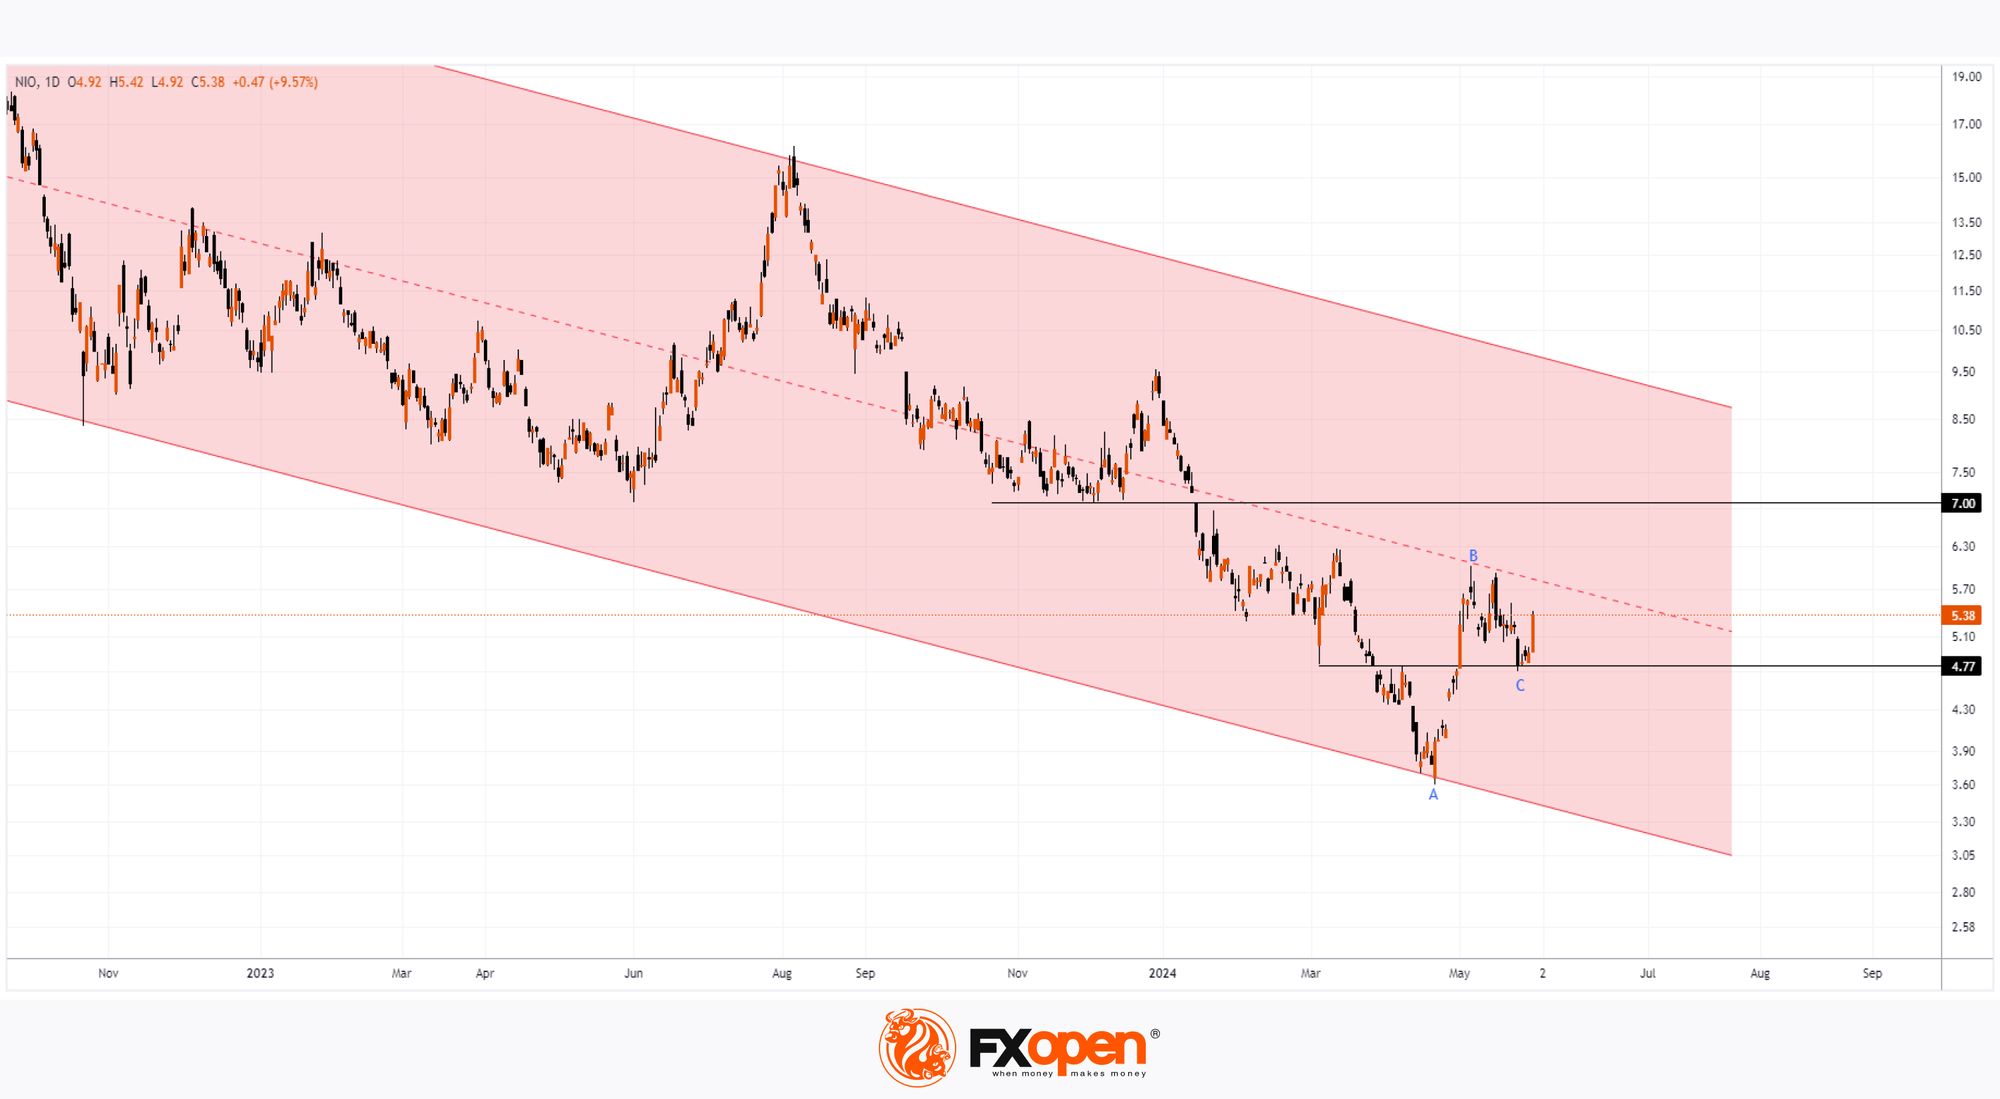
As evidenced by the NIO stock price chart, yesterday's trading closed at $4.93, while today the NIO share price is around $5.40, indicating an increase of over 9%.
According to MarketWatch, the rise is driven by expectations that the Chinese electric vehicle manufacturer's deliveries are likely to reach record levels.
The existing record was set in July last year when the company achieved monthly sales of 20,462 cars. However, analysts believe this result could be surpassed in May this year due to ongoing discounts on new cars and batteries.
The daily chart of NIO shares today shows that the price is in a long-term downtrend (indicated by the red trend channel) due to the global decline in demand for electric vehicles.
However, there are fundamental reasons to expect that the downward trend will be broken:
→ China is intensifying its efforts to develop electric vehicles – the State Council has presented an action plan for decarbonisation.
→ This month, the International Monetary Fund raised its forecast for China's economic growth in 2024 from 4.6% to 5%.
Technical analysis of the NIO stock chart shows that:
→ The price is in a downtrend and below the median line, which can be expected to provide resistance.
→ Resistance may also be encountered at the $7 per share level, which acted as support at the end of 2023.
→ The $4.77 level has changed its role several times but has provided support over the past 10 days, giving the bulls a foothold.
→ The minimum C is at the 50% level of the A→B impulse, which is a sign of a bull market.
On June 6, NIO will present its report for the first quarter of 2024. If the report is strong, it could give the bulls more confidence and lead to attempts to reverse the long-term downtrend.
Buy and sell stocks of the world's biggest publicly-listed companies with CFDs on FXOpen’s trading platform. Open your FXOpen account now or learn more about trading share CFDs with FXOpen.
This article represents the opinion of the Companies operating under the FXOpen brand only. It is not to be construed as an offer, solicitation, or recommendation with respect to products and services provided by the Companies operating under the FXOpen brand, nor is it to be considered financial advice.
Stay ahead of the market!
Subscribe now to our mailing list and receive the latest market news and insights delivered directly to your inbox.


Latest articles

AI Valuations Are Back in the Spotlight
Artificial intelligence remains the dominant investment theme of 2026, but investors are increasingly questioning whether AI stock valuations are keeping pace with reality.
💰 Big Tech continues to invest at an unprecedented scale, with hyperscaler AI spending projected to exceed $800

AUD/CAD: Months of Indecision — Is a Breakout Finally Coming?
The Australian dollar has clawed back most of its end-of-June losses, when it touched three-month lows against the greenback amid escalating Middle East tensions. Since then, sentiment has improved: the RBA's Assistant Governor Sarah Hunter signalled the board stands ready

USD/JPY: Battling at the Top of the Triangle
On 3 July, Japan's Finance Minister, Satsuki Katayama, stated that the Ministry of Finance remains in close contact with US authorities regarding developments in USD/JPY as the yen traded near its weakest level in almost 40 years. Similar verbal