


NVDA Analysis: Share Price Reaches 2-month High on News of New Chips
FXOpen

Less than a month ago, US officials tightened rules on sales of high-end artificial intelligence chips to China. And yesterday, from the SemiAnalysis newsletter, it became known that Nvidia has developed new chips called HGX H20, L20 PCIe and L2 PCIe, which are not subject, in whole or in part, to existing export restrictions to China.
The news about the new chips gave bullish momentum to the Nvidia stock market.
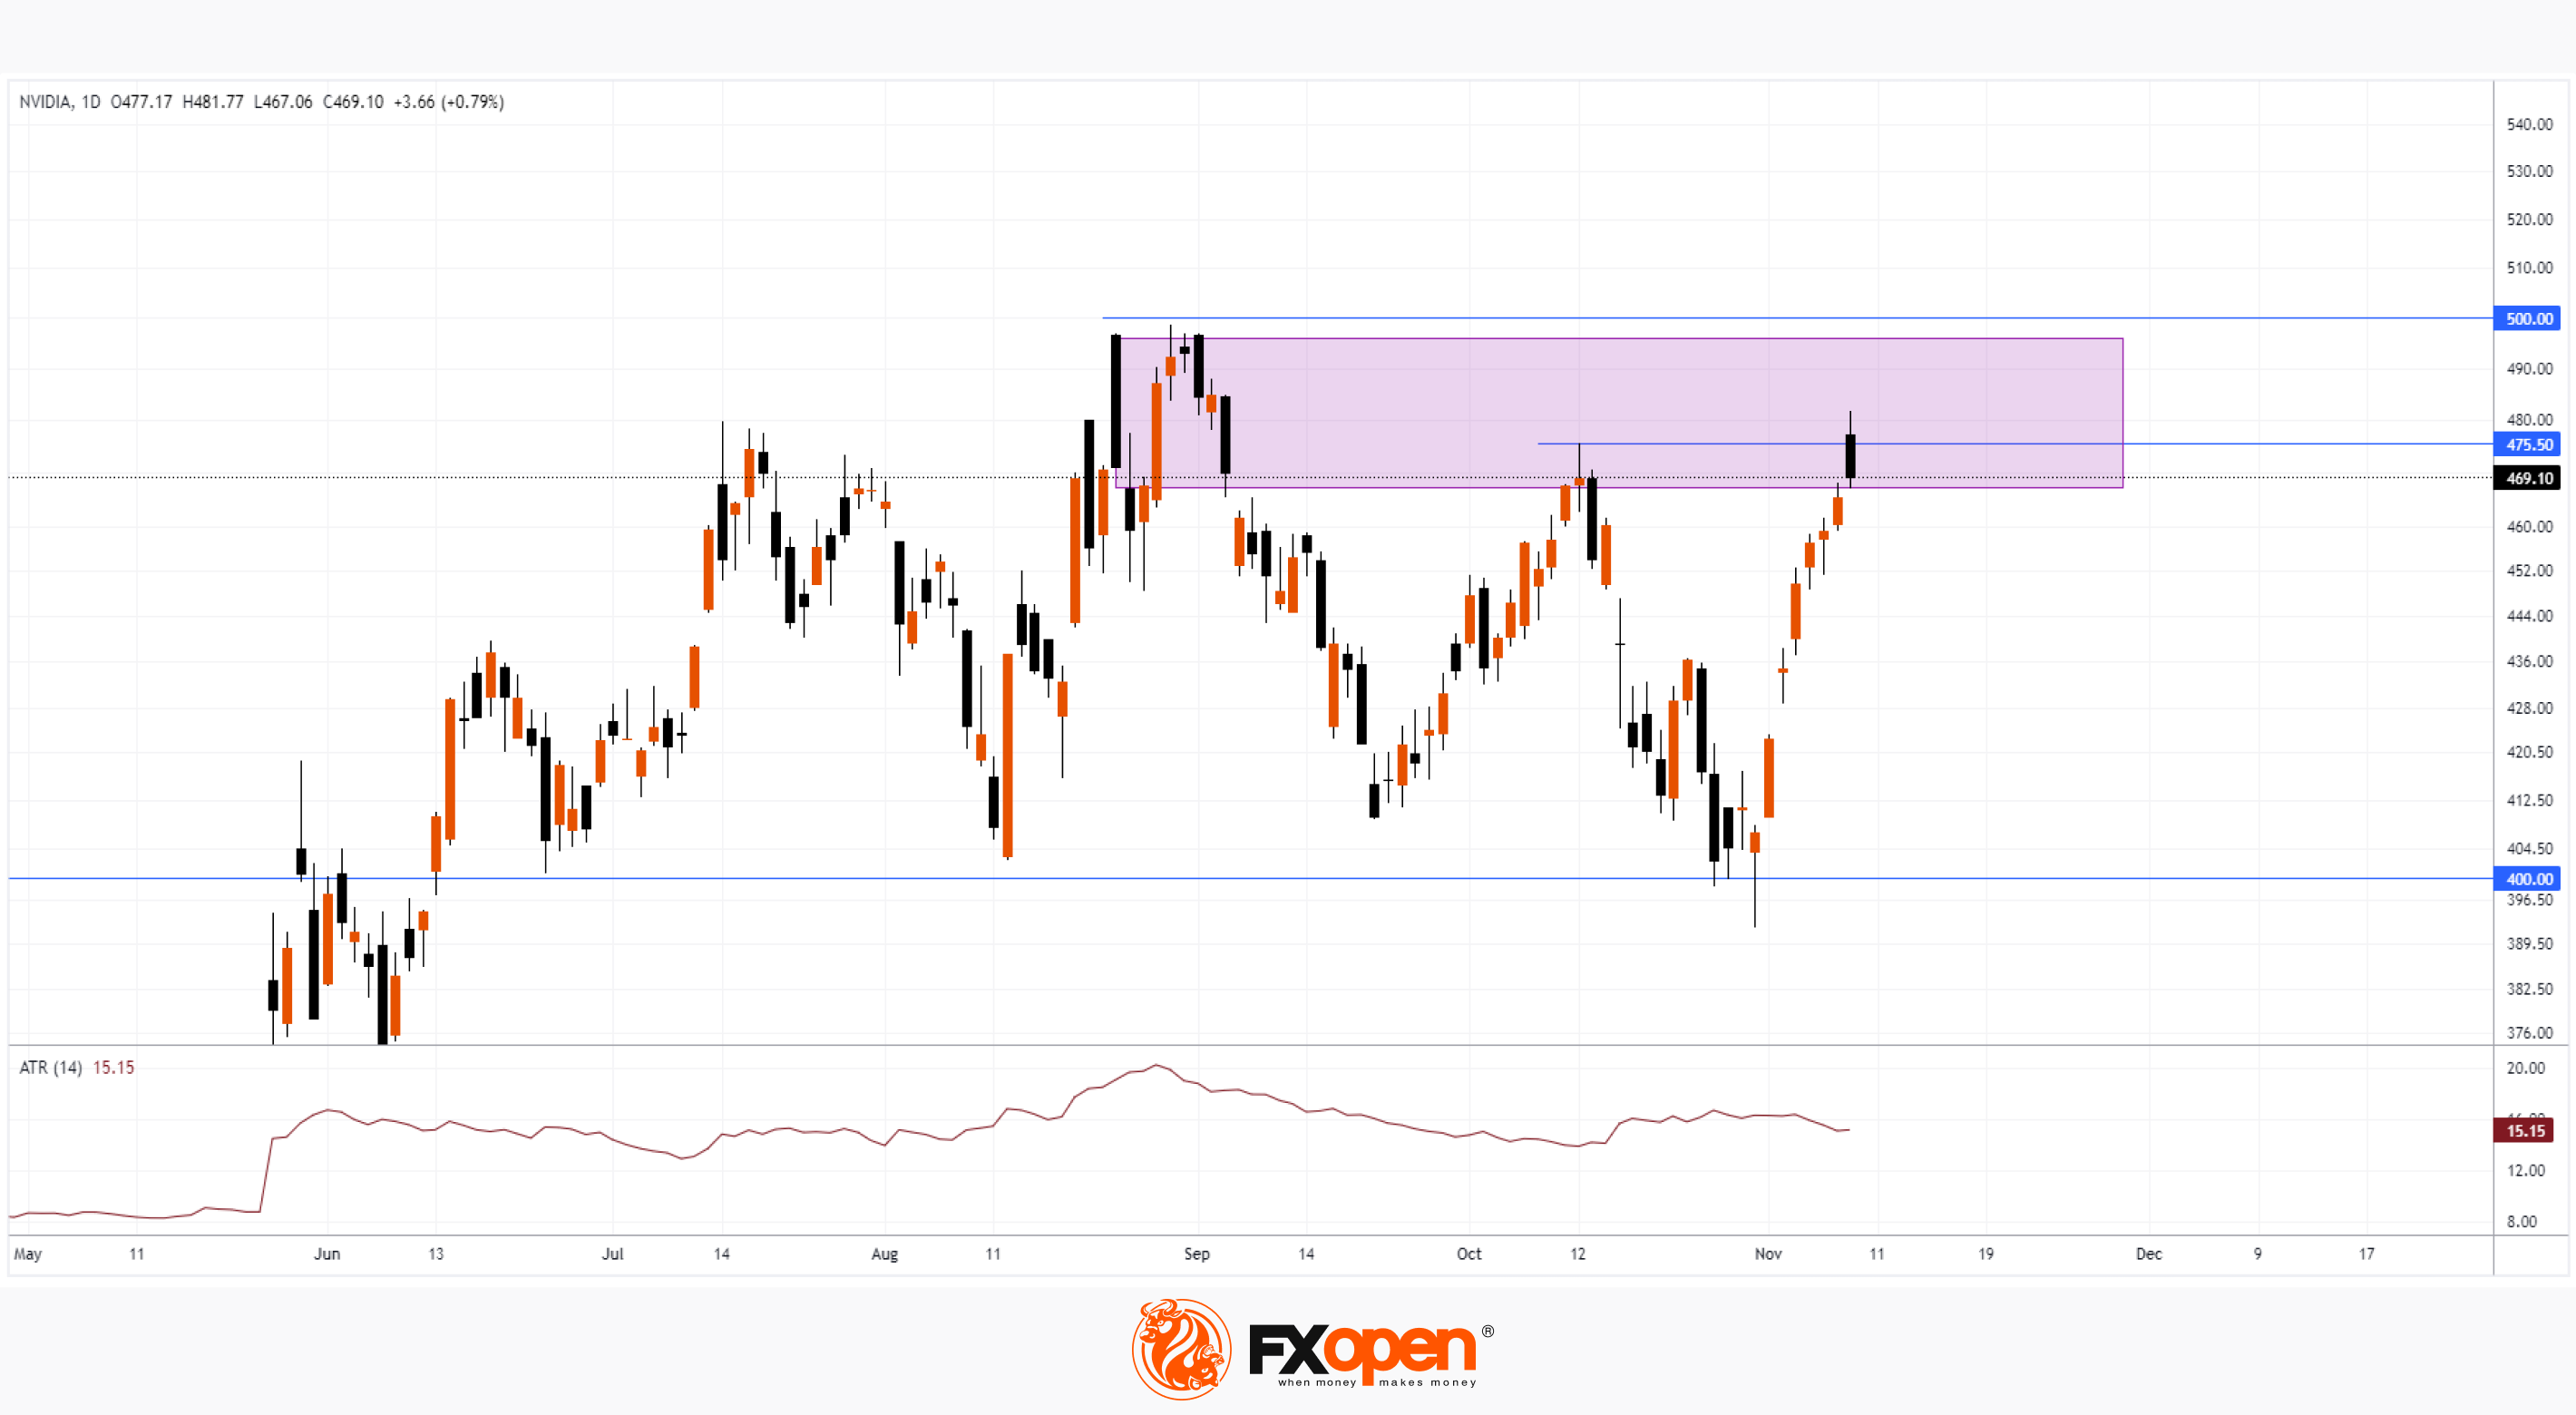
The NVDA stock price chart shows that:
→ the price crossed the peak on October 12 (this is peak D, the formation of which we assumed in the analysis of the NVDA stock price on September 14);
→ NVDA share price shows bullish dynamics after a false breakout of the psychological level of USD 400 per share at the end of October;
→ the price dropped at the end of yesterday's trading day, forming a potential false breakout of the October peak. It seems that the bears have become more active, trapping overly optimistic buyers. The 4-hour chart shows a bearish engulfing pattern.
Note that the market was extremely volatile at the end of August, as evidenced by the ATR indicator. In this active market, large participants had enough counter liquidity to cover long positions (take short positions). And now, with the price rising to the levels of this important August range, the bulls may exhaust their confidence. To overcome it, strong drivers are needed, which can happen during the publication of the company's report for the 3rd quarter — it is scheduled for November 21.
Buy and sell stocks of the world's biggest publicly-listed companies with CFDs on FXOpen’s trading platform. Open your FXOpen account now or learn more about trading share CFDs with FXOpen.
This article represents the opinion of the Companies operating under the FXOpen brand only. It is not to be construed as an offer, solicitation, or recommendation with respect to products and services provided by the Companies operating under the FXOpen brand, nor is it to be considered financial advice.
Stay ahead of the market!
Subscribe now to our mailing list and receive the latest market news and insights delivered directly to your inbox.


Latest articles

US Dollar Strengthens Amid Equity Market Weakness and Hawkish Fed Rhetoric
The US dollar continues to hold firm near multi-year highs as sentiment across equity markets deteriorates and investors increasingly expect the Federal Reserve to maintain a restrictive monetary policy stance for longer. The US economy remains resilient, while inflation risks

Bitcoin: Corrective Channel Broken as Traders Turn More Active
Bitcoin has come under the influence of several factors simultaneously. The wave of selling at the beginning of June was linked to Strategy's first disclosed Bitcoin sale in several years, a prolonged series of outflows from spot ETFs, and a

DAX 40: consolidation amid technology sell-off
A wave of selling in the technology sector that emerged earlier this week has weighed on European equities. The trigger was investor concern over the profitability of large-scale debt-funded investments by major US tech companies in AI infrastructure. The Nasdaq