


FXOpen

Postmarket, NVDA jumped +9% to break the USD 500-per-share psychological level for the first time, supported by strong Q2 data:
→ earnings per share: USD 2.70 (expected USD 2.08);
→ company revenue: USD 13.5 bn (expected USD 11.2 bn);
→ 3Q revenue forecast: USD 16 billion
Nvidia also unveiled a USD 25 billion share buyback plan. Demand for NVDA shares also boosted stock prices of other AI-related tech giants: MSFT, GOOG, AMD.
Bullish arguments:
→ the report showed that interest in the topic of AI remains, and NVDA can be the main beneficiary of this progress. By some estimates, over the next 10 years, companies will spend USD 800 billion building and training their models.
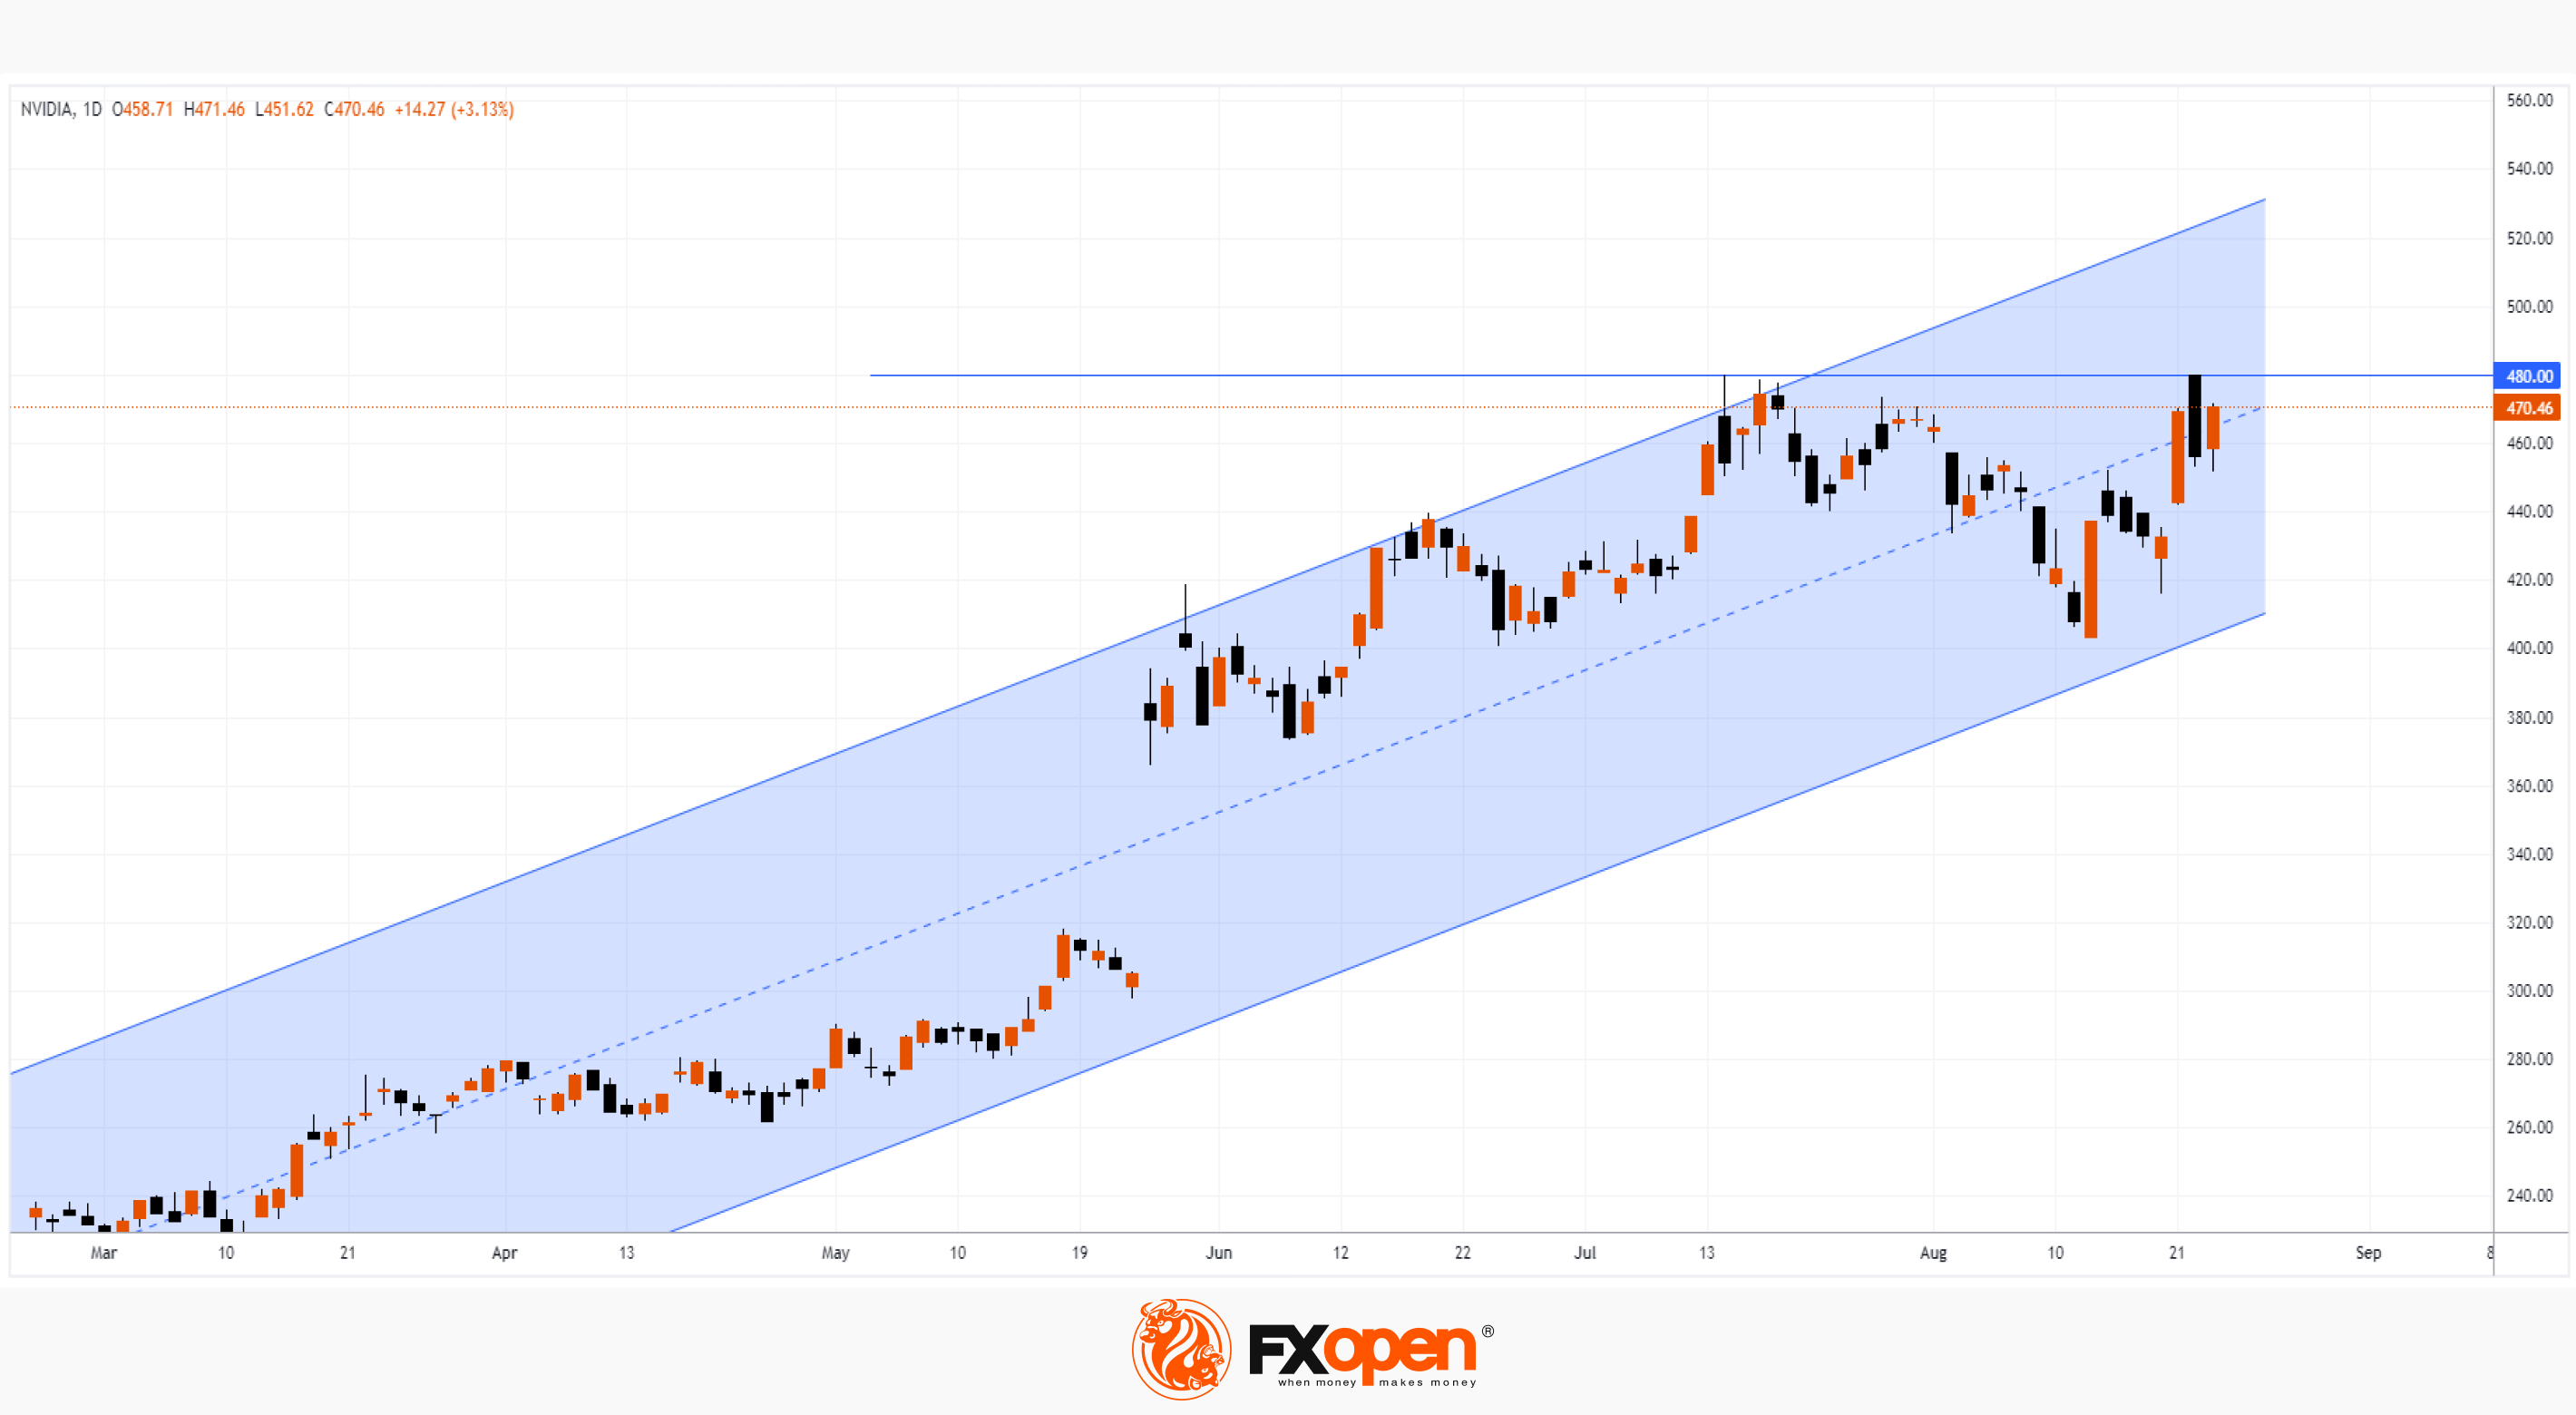
→ the price of NVDA shares exceeded the level of USD 480, which previously served as resistance. Now support can be expected at this level.
→ Also, a gap, which should be formed at the opening of today's session, will certainly be able to provide support.
Bearish arguments:
→ resistance to the growth of the NVDA share price may be provided by the upper limit of the rising channel. It is possible that after the emotions from the strong report subside, there will be a correction — as an option, with a test of the psychological level of USD 500 per share.
Buy and sell stocks of the world's biggest publicly-listed companies with CFDs on FXOpen’s trading platform. Open your FXOpen account now or learn more about trading share CFDs with FXOpen.
This article represents the opinion of the Companies operating under the FXOpen brand only. It is not to be construed as an offer, solicitation, or recommendation with respect to products and services provided by the Companies operating under the FXOpen brand, nor is it to be considered financial advice.
Stay ahead of the market!
Subscribe now to our mailing list and receive the latest market news and insights delivered directly to your inbox.


Latest articles

XAG/USD Analysis: Silver Drops to March Low
As seen on the XAG/USD chart, the price of silver fell to the $70 level and briefly pierced it, marking the lowest level since early February.
Although geopolitical tensions typically support demand for safe-haven assets, silver is under pressure

XBR/USD Analysis: Brent Crude Rises Above $110
Yesterday, Brent crude prices moved sharply higher, with the XBR/USD chart showing breakouts above local resistance levels. Today, the price has climbed above the $110 mark, bringing it close to the multi-year high recorded on 9 March.
The bullish