


NVDA Share Price Soars 11% after Report
FXOpen

The signs of concern we wrote about yesterday have largely subsided. After three days of declines, the price of E-mini Nasdaq 100 futures bounced off the lower boundary of the channel (see yesterday's chart) and rose, led by NVDA stock.
Nvidia's quarterly report exceeded expectations:
→ earnings per share: actual = USD 5.16, expected = USD 4.59;
→ gross revenue: actual = USD 22.10 billion, expected = USD 20.39 billion.
According to the head of the company:
→ Accelerated computing and generative AI have reached a tipping point.
→ Demand for computing is growing worldwide among companies, industries and governments.
→ The coming year will bring major new product cycles with exceptional innovations that will help propel the industry forward.
In post-market trading, NVDA's price rose 11% to over USD 740 per share. Thus, the price increase for NVDA since the beginning of 2024 is about 50%.
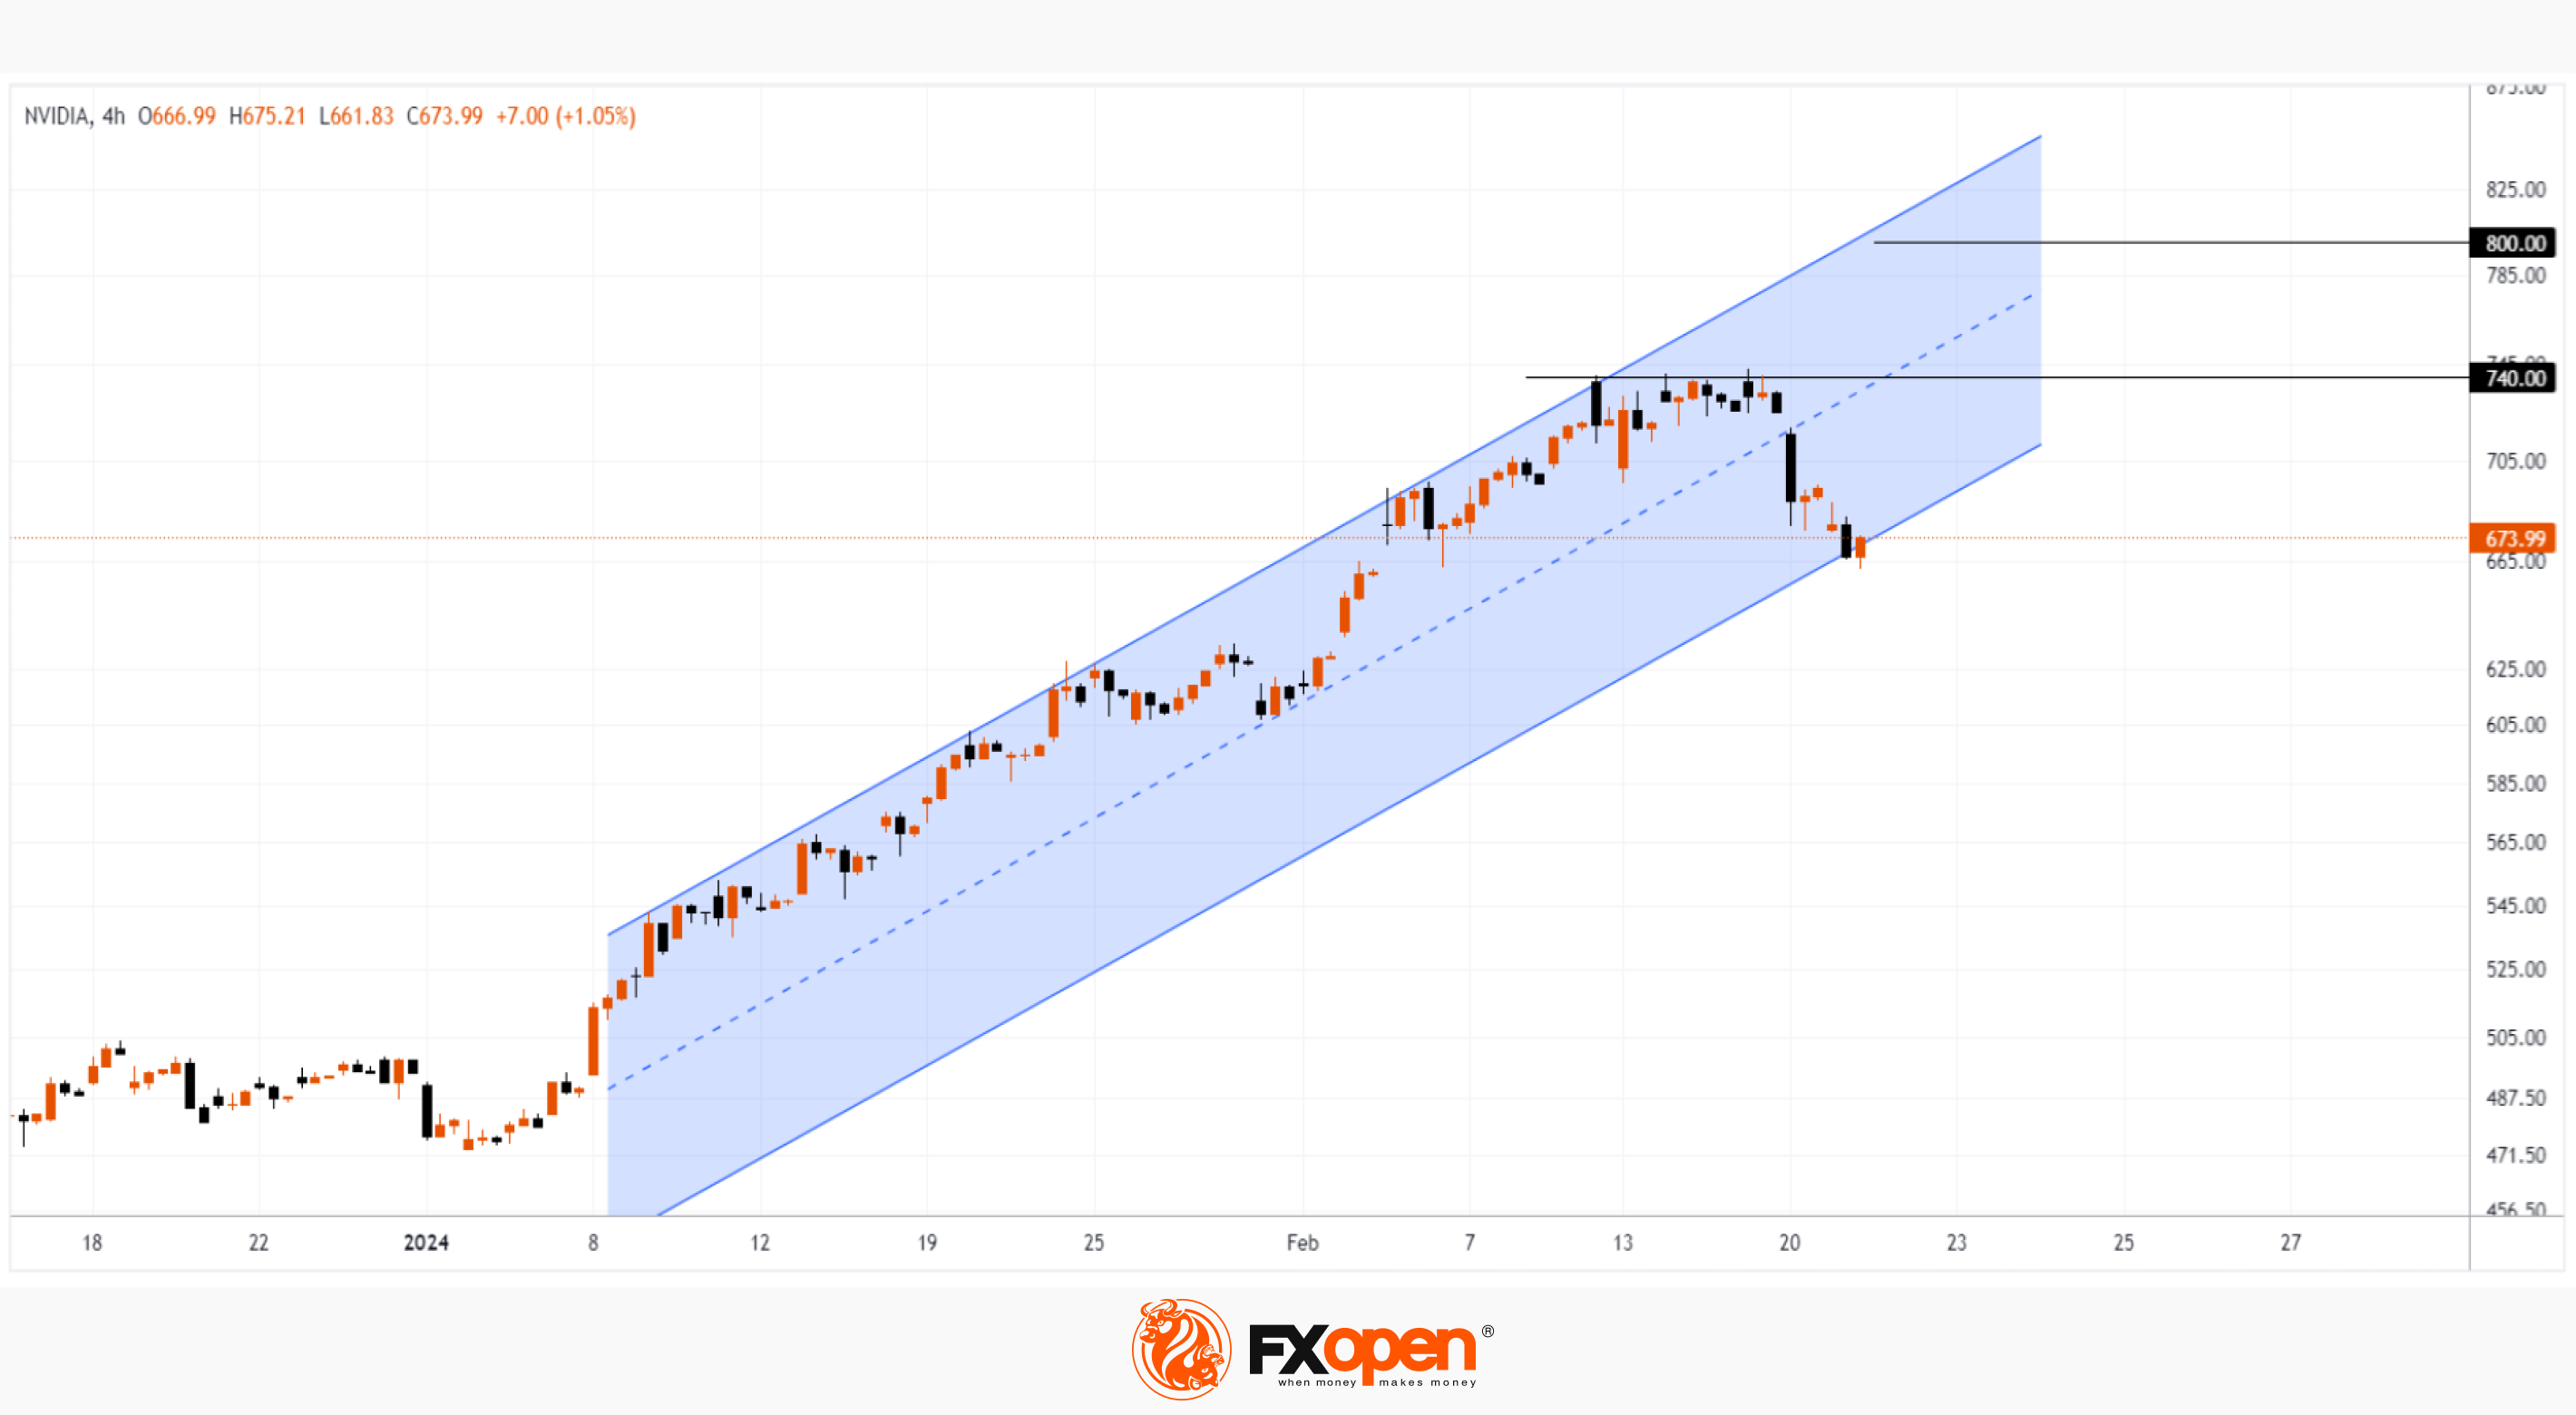
The NVDA stock chart shows that:
→ the USD 740 level acted as resistance in February;
→ however, taking into account the post-market price, we can assume that today at the opening of trading this resistance level will be broken and in the future, according to the logic of technical analysis, will begin to provide support;
→ in this case, a rebound will be formed from the lower line of the channel (shown in blue) and a wide bullish gap.
It's likely that the excitement surrounding Nvidia's strong report will continue. But the closer the price of NVDA rises to the upper border of the channel (which is located around the psychological level of USD 800), the more signs of overbought there will be on the indicators — therefore, the preconditions will be created for a correction after the extraordinary growth.
Buy and sell stocks of the world's biggest publicly-listed companies with CFDs on FXOpen’s trading platform. Open your FXOpen account now or learn more about trading share CFDs with FXOpen.
This article represents the opinion of the Companies operating under the FXOpen brand only. It is not to be construed as an offer, solicitation, or recommendation with respect to products and services provided by the Companies operating under the FXOpen brand, nor is it to be considered financial advice.
Stay ahead of the market!
Subscribe now to our mailing list and receive the latest market news and insights delivered directly to your inbox.


Latest articles

Ethereum: Has the Recovery Begun?
Ethereum has staged a notable rebound after once again testing the heavily watched psychological zone around 1500$. Since bouncing off this support, ETH/USD has climbed roughly 13%, now trading around the $1,700 mark.
This recovery is being driven

Oil Prices Are Back at Pre-Conflict Levels. Analysts Are Divided
At the start of May, oil markets were still pricing in elevated geopolitical risk and expectations of sustained supply disruption.
But easing tensions between Washington and Tehran, along with improving supply expectations, have rapidly shifted sentiment back toward fundamentals.
📉 Brent

The Dollar Awaits the Week’s Key Report: AUD/USD and NZD/USD at Crucial Technical Levels
Following mixed performance by the US dollar earlier this week, investors are now fully focused on the June Nonfarm Payrolls report, which will be released on Thursday rather than Friday. The schedule has been brought forward as US financial markets