


NVDA Stock Analysis: Reversal Pattern Forming on the Chart
FXOpen

NVDA stock has been a stock market leader throughout 2023 amid the AI boom. NVDA's share price rose by more than 200%, allowing NVidia's capitalization to exceed USD 1 trillion.
However, a pattern is forming on the chart, warning that NVDA's share price may decline. This is a diamond pattern A-B-C-D (determining the position of point D still takes time), which is formed from intersecting parallel lines of support and resistance. They are shown on the chart using ascending and descending channels.
Even though this instance of the pattern is far from the standard, it deserves attention.
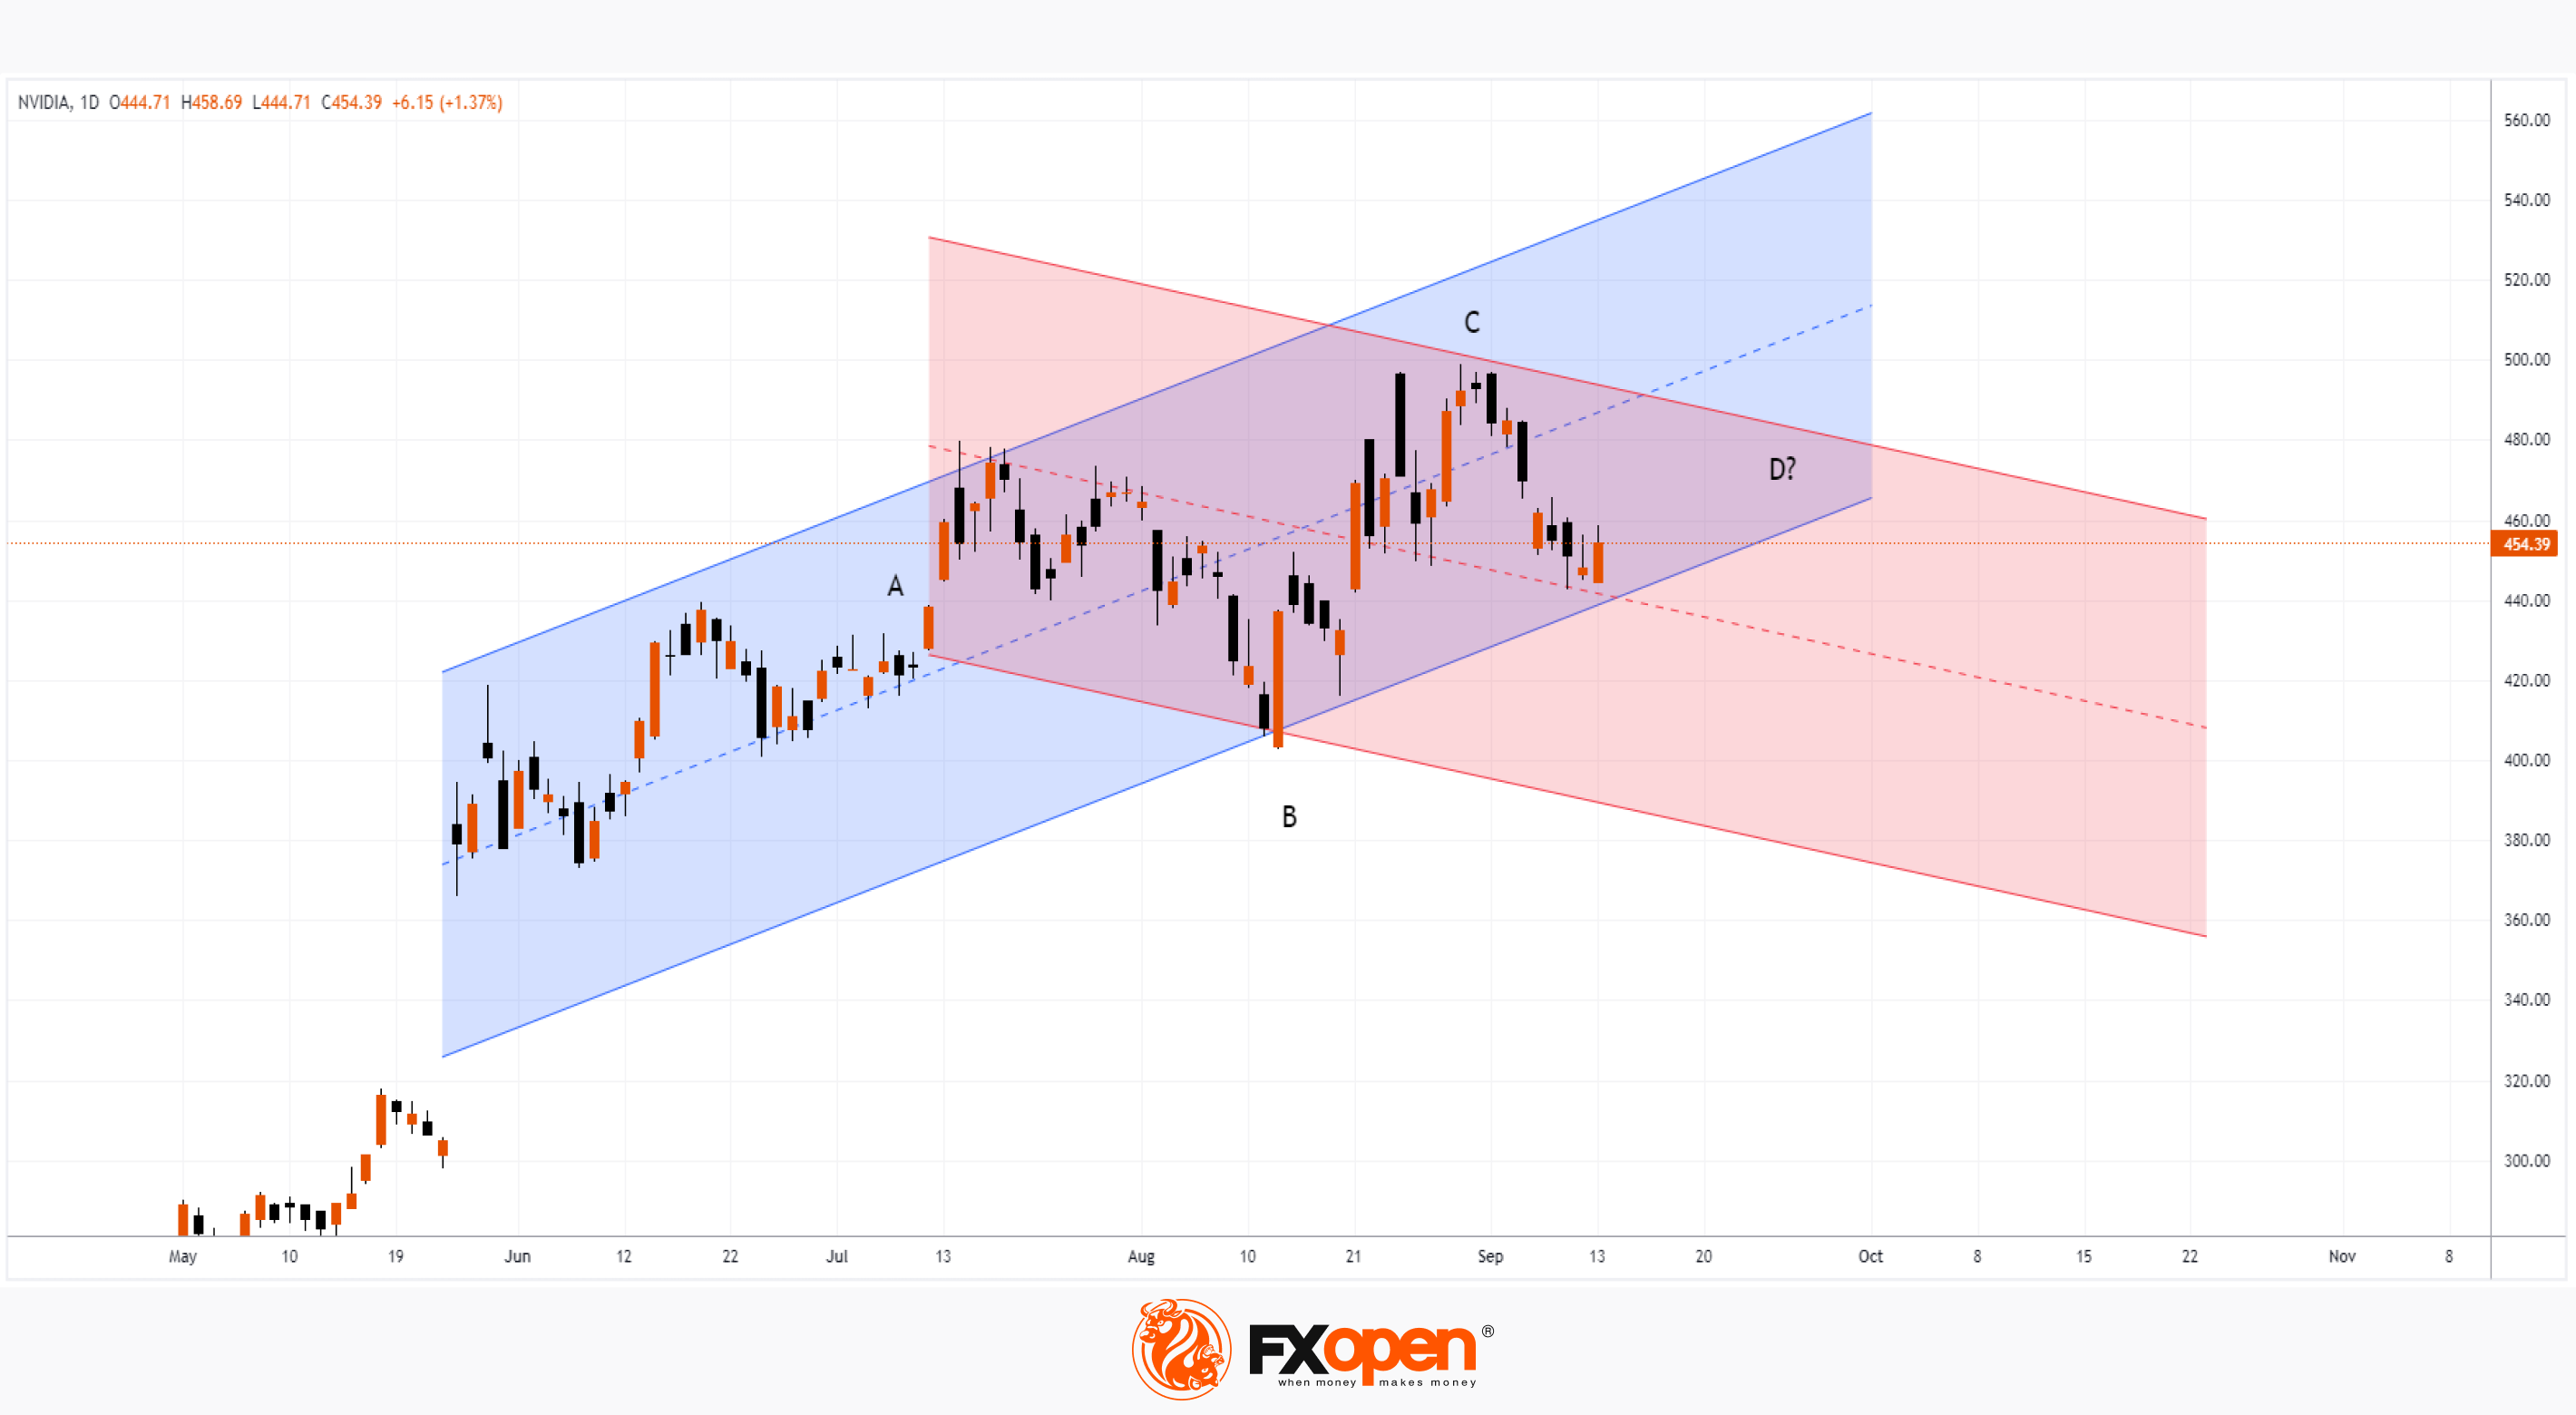
Arguments confirming that the pattern can work:
→ in September, NVDA stock performed weaker than the S&P 500 index;
→ at the top of the diamond, there were high trading volumes, according to the NASDAQ exchange. The current price is below the levels at which high-volume transactions were recorded at the end of August. This can be interpreted as the fact that large market participants are taking profits (and/or even taking a short position);
→ the media is disseminating information that NVDA shares were sold by Berkshire (managed by Buffett) and the company's president Jen Huang herself — according to Yahoo Finance, on September 11, she sold about 30k shares.
Could the AI boom be winding down? According to investor Rob Arnott, Nvidia stock is a bubble. And if it bursts, it could trigger a collapse of the entire stock market.
Buy and sell stocks of the world's biggest publicly-listed companies with CFDs on FXOpen’s trading platform. Open your FXOpen account now or learn more about trading share CFDs with FXOpen.
This article represents the opinion of the Companies operating under the FXOpen brand only. It is not to be construed as an offer, solicitation, or recommendation with respect to products and services provided by the Companies operating under the FXOpen brand, nor is it to be considered financial advice.
Stay ahead of the market!
Subscribe now to our mailing list and receive the latest market news and insights delivered directly to your inbox.


Latest articles

Microsoft Shares Two Days Ahead of Earnings Release
In January, Microsoft shares came under pressure following the company’s earnings report. Although both revenue and earnings per share exceeded analysts’ expectations, growth in the Azure cloud platform slowed to 39% year-on-year from 40% in the previous quarter—enough

Market Analysis: GBP/USD Builds Momentum While EUR/GBP Dips Once More
GBP/USD is showing positive signs above 1.3500 and 1.3525. EUR/GBP declined and is now consolidating losses below 0.8700.
Important Takeaways for GBP/USD and EUR/GBP Analysis Today
· The British Pound started a fresh increase

Weekly Market Insights with Gary Thomson: The Week of Central Banks and Earnings Reports
In this video, we’ll explore the key economic events and market trends, shaping the financial landscape. Get ready for insights into financial markets to help you navigate the week ahead. Let’s dive in!
In this episode of Market