


FXOpen

Yesterday, after the close of the main trading session, Nvidia released its second-quarter earnings report:
→ Earnings per share: actual = $0.67, expected = $0.647;
→ Revenue: $30.04 billion, expected = $28.737 billion;
→ The company also announced a $50 billion share buyback.
However, despite the strong results, Nvidia’s share price declined. While the closing price yesterday was above $125, in pre-market trading today, Nvidia's shares are down below $118.
The more than 6% drop may be due to:
→ The company’s future outlook not meeting investor expectations;
→ Waning bullish sentiment around AI adoption.
On 12 August, during a technical analysis of NVDA’s price chart, we noted:
→ The price was forming an upward channel (indicated in blue);
→ The $100 level was acting as support.
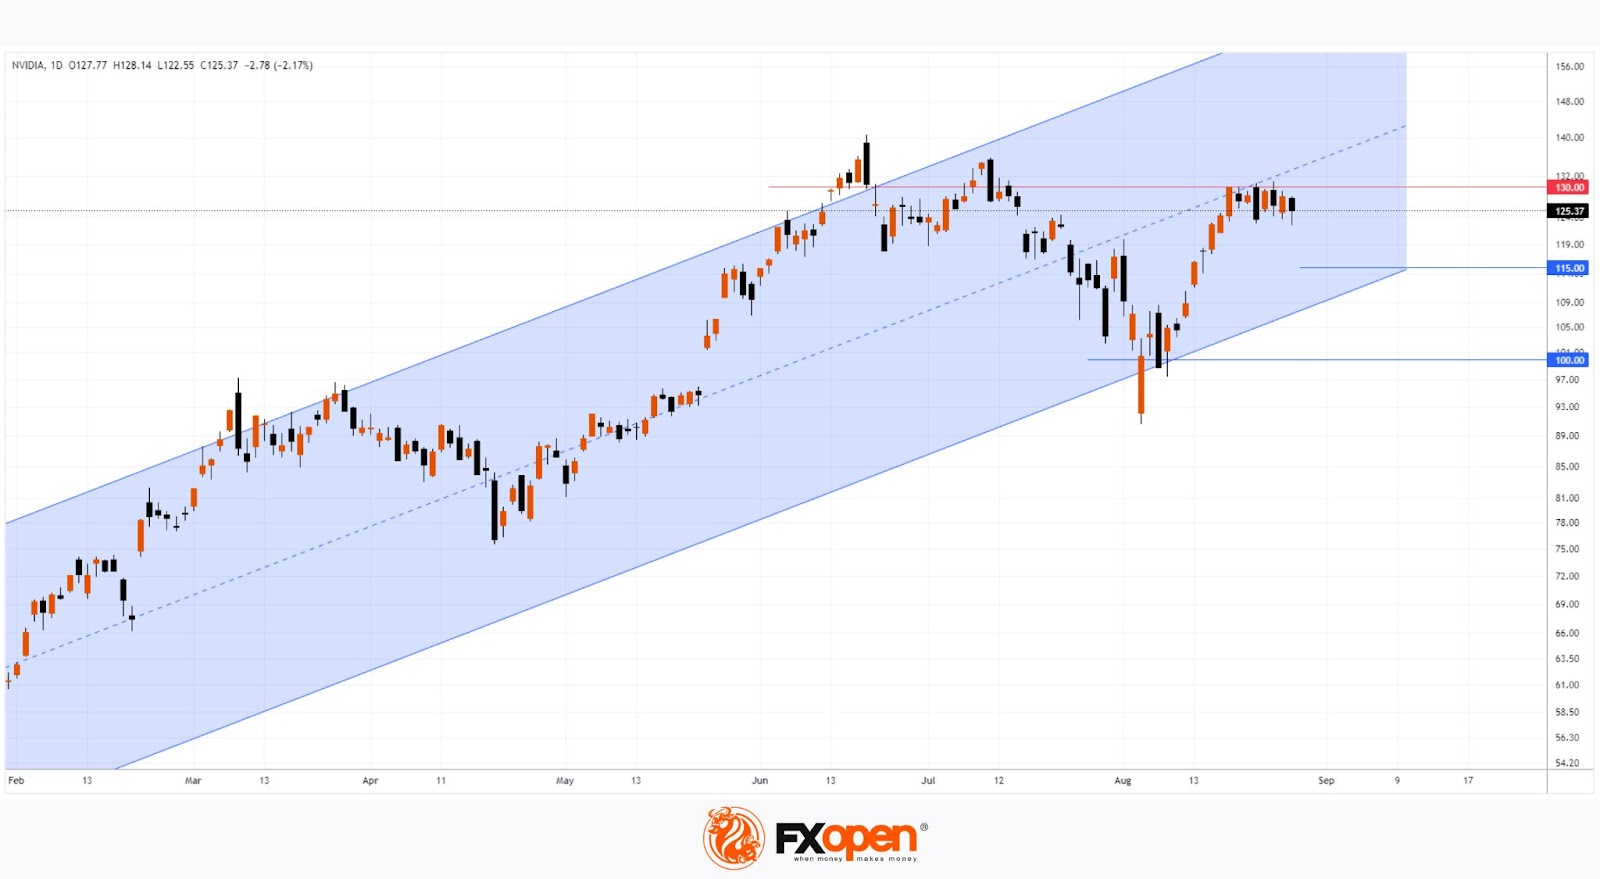
Assuming the bearish momentum from the earnings reaction continues, Nvidia’s shares may open trading today around $115, close to the lower boundary of the current upward channel.
New data provides crucial insights for further predictions:
→ After retreating from the $130 resistance level, the price is likely to form a broad bearish gap around the $120 level, which could act as a future resistance zone.
→ The median line of the blue channel may then act as resistance, increasing the likelihood of a bearish breakout below the channel’s lower boundary.
Meanwhile, analysts remain optimistic. According to a Tipranks survey, 33 out of 36 analysts recommend buying NVDA stock. While the average price target is $150 over the next 12 months, it’s possible that these estimates could be revised downward if bearish sentiment intensifies.
Read analytical NVDA price forecasts for 2024 and beyond.
Buy and sell stocks of the world's biggest publicly-listed companies with CFDs on FXOpen’s trading platform. Open your FXOpen account now or learn more about trading share CFDs with FXOpen.
This article represents the opinion of the Companies operating under the FXOpen brand only. It is not to be construed as an offer, solicitation, or recommendation with respect to products and services provided by the Companies operating under the FXOpen brand, nor is it to be considered financial advice.
Stay ahead of the market!
Subscribe now to our mailing list and receive the latest market news and insights delivered directly to your inbox.


Latest articles

European Currencies Decline: Pound Hits New Lows, Euro Under Pressure
European currencies continue to weaken against the US dollar amid rising geopolitical tensions and increased demand for safe-haven and liquid assets. Market participants are reducing exposure to riskier instruments, putting pressure on both the euro and the pound. Additional support

Market Analysis: GBP/USD Dips Further As EUR/GBP Regains Traction
GBP/USD failed to climb above 1.3500 and corrected some gains. EUR/GBP started a decent increase and might aim for more gains above 0.8700.
Important Takeaways for GBP/USD and EUR/GBP Analysis Today
· The British Pound
