


FXOpen

According to the Nvidia (NVDA) stock chart, yesterday’s closing price was just below $117, compared to just over $108 the day before. The positive momentum was largely driven by the stock market’s reaction to inflation news, as mentioned earlier.
For Nvidia investors, this is a clear sign that the stock is regaining its leadership position, a success attributed to CEO Jensen Huang.
As Barron’s reports, at the Goldman Sachs conference in San Francisco, Huang discussed the launch of the new Blackwell chip and the return on investment for Nvidia’s clients. He mentioned that demand is so high that some companies Nvidia works with have become "emotional."
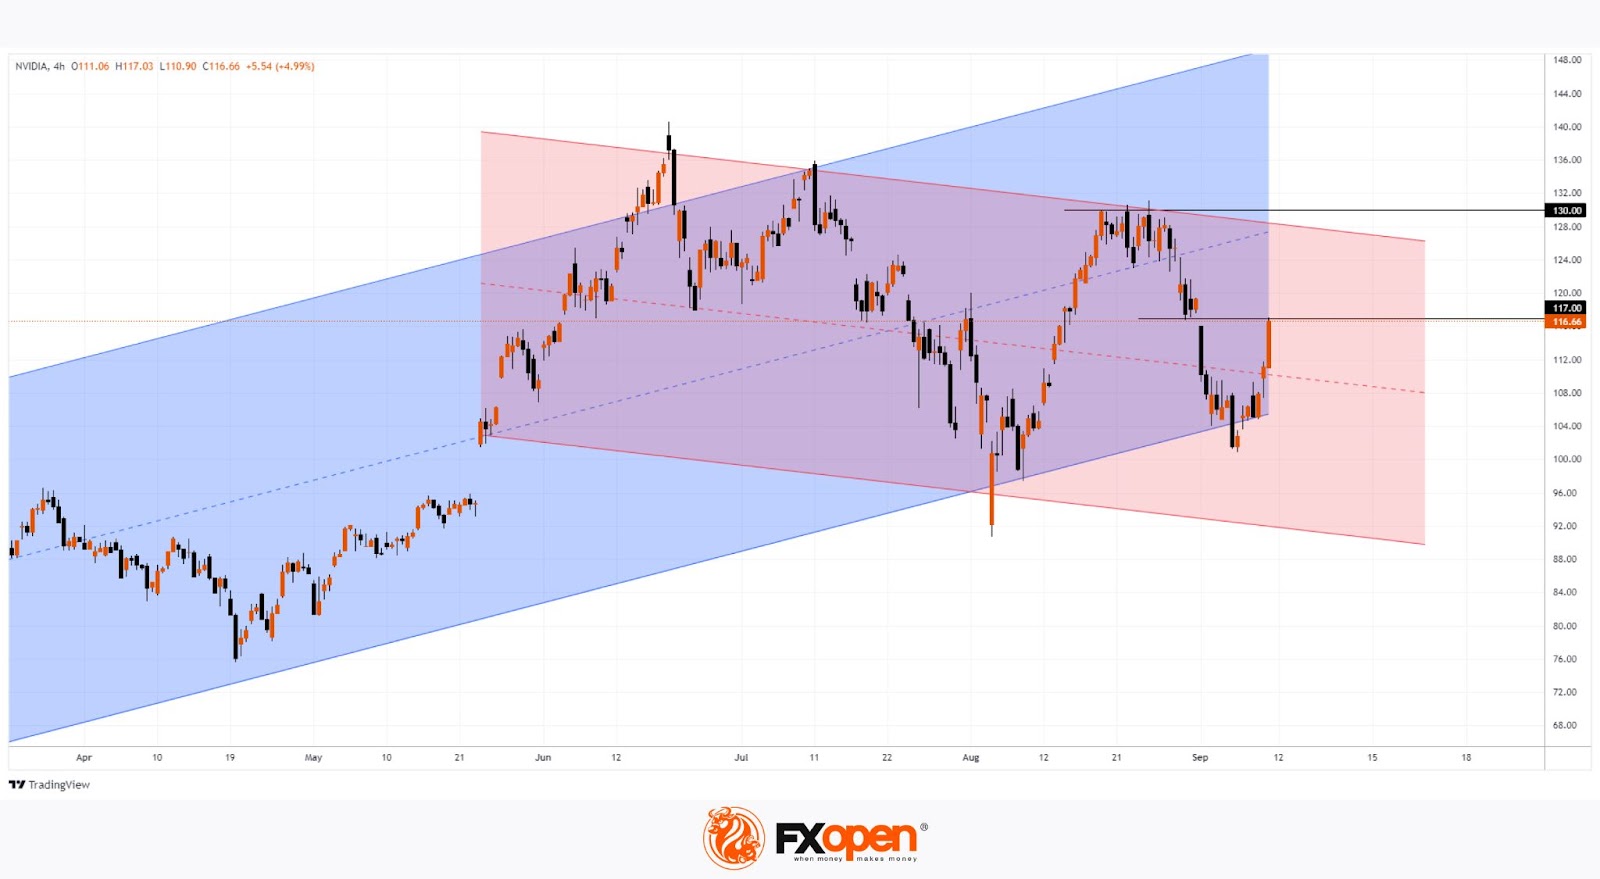
Technical analysis of Nvidia's (NVDA) stock chart shows the price forming an ascending linear regression channel (shown in blue), rebounding from its lower boundary.
However, bulls will need to prove their strength, as a series of resistance levels lie ahead:
→ The bearish gap zone around $117. → The psychological level of $130. → The upper boundary of the descending channel (shown in red).
If the Federal Reserve cuts rates next week and Powell’s comments are dovish, Nvidia’s stock could break through this resistance and continue its impressive 2024 rally, which saw the price increase by around 150% in the first half of the year.
Analyst forecasts remain optimistic. According to a Tipranks survey of 42 analysts, 39 recommend buying NVDA stock, with an average price target of $153.24 over the next 12 months.
Read analytical NVDA price forecasts for 2024 and beyond.
Buy and sell stocks of the world's biggest publicly-listed companies with CFDs on FXOpen’s trading platform. Open your FXOpen account now or learn more about trading share CFDs with FXOpen.
This article represents the opinion of the Companies operating under the FXOpen brand only. It is not to be construed as an offer, solicitation, or recommendation with respect to products and services provided by the Companies operating under the FXOpen brand, nor is it to be considered financial advice.
Stay ahead of the market!
Subscribe now to our mailing list and receive the latest market news and insights delivered directly to your inbox.


Latest articles

Market Analysis: GBP/USD Dips Further As EUR/GBP Regains Traction
GBP/USD failed to climb above 1.3500 and corrected some gains. EUR/GBP started a decent increase and might aim for more gains above 0.8700.
Important Takeaways for GBP/USD and EUR/GBP Analysis Today
· The British Pound


Market Insights with Gary Thomson: Oil, US Retail Sales & NFP in Focus
In this video, we’ll explore the key economic events and market trends, shaping the financial landscape. Get ready for insights into financial markets to help you navigate the week ahead. Let’s dive in!
In this episode of Market