


S&P 500 Rises Following Inflation Data Release
FXOpen

Historically, September has been the worst month for the S&P 500 (US SPX 500 mini on FXOpen), and the start of the month reflected this trend, with the index dropping around 4.5% from 1 to 6 September, indicating bearish sentiment.
However, yesterday's event — the release of the Consumer Price Index (CPI) — may have marked a turning point.
According to Reuters, US inflation data showed that the core CPI rose by 0.28% in August, slightly above the forecast of 0.2%. This led market participants to believe that the Federal Reserve might agree to a 25-basis point rate cut next Wednesday.
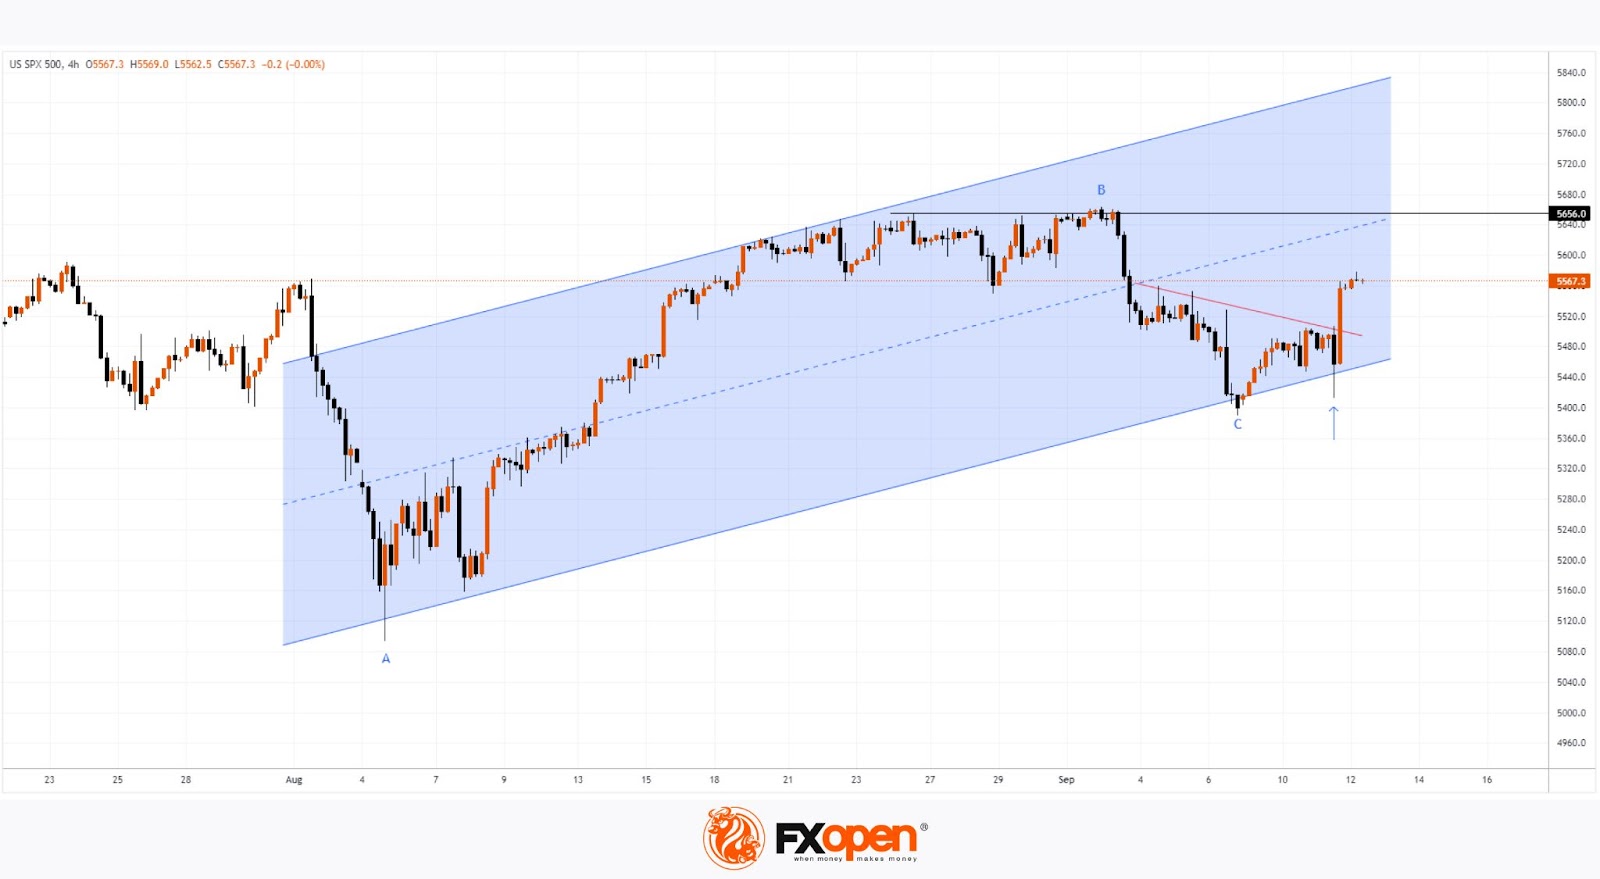
Technical analysis of the S&P 500 (US SPX 500 mini on FXOpen) chart indicates:
→ The price is moving within an ascending channel (shown in blue), having rebounded from its lower boundary yesterday and breaking the local descending trend line (shown in red).
→ The movement from B to C is approximately 50% of the A to B impulse, a bullish signal that suggests the "normal" correction may be complete, indicating a potential rally from the 5 August low.
→ Yesterday's price drop was a false move (indicated by the arrow), creating a bear trap.
As of mid-month, the outlook appears positive. It’s possible that the S&P 500 (US SPX 500 mini on FXOpen) could finish the month in the green, though the Fed's long-anticipated rate cut decision, expected next week, will play a crucial role in this outcome.
Trade global index CFDs with zero commission and tight spreads (additional fees may apply). Open your FXOpen account now or learn more about trading index CFDs with FXOpen.
This article represents the opinion of the Companies operating under the FXOpen brand only. It is not to be construed as an offer, solicitation, or recommendation with respect to products and services provided by the Companies operating under the FXOpen brand, nor is it to be considered financial advice.
Stay ahead of the market!
Subscribe now to our mailing list and receive the latest market news and insights delivered directly to your inbox.


Latest articles

AI Valuations Are Back in the Spotlight
Artificial intelligence remains the dominant investment theme of 2026, but investors are increasingly questioning whether AI stock valuations are keeping pace with reality.
💰 Big Tech continues to invest at an unprecedented scale, with hyperscaler AI spending projected to exceed $800

AUD/CAD: Months of Indecision — Is a Breakout Finally Coming?
The Australian dollar has clawed back most of its end-of-June losses, when it touched three-month lows against the greenback amid escalating Middle East tensions. Since then, sentiment has improved: the RBA's Assistant Governor Sarah Hunter signalled the board stands ready

USD/JPY: Battling at the Top of the Triangle
On 3 July, Japan's Finance Minister, Satsuki Katayama, stated that the Ministry of Finance remains in close contact with US authorities regarding developments in USD/JPY as the yen traded near its weakest level in almost 40 years. Similar verbal