


FXOpen

On 13 November, we analysed Nvidia’s (NVDA) price chart and noted:
→ The continuation of a long-term upward channel (highlighted in blue).
→ A consolidation below the psychological $150 level, forming a narrowing triangle along the Quater Line, which divides the lower half of the channel.
On 20 November, Nvidia released its Q3 earnings report, which exceeded analysts’ expectations:
→ Earnings per share (EPS): $0.81 (expected: $0.74).
→ Revenue: $35.08 billion (expected: $33.17 billion).
→ Revenue growth: +94% year-on-year, +17% quarter-on-quarter.
Key Insights (via Reuters):
→ Optimism centres on Nvidia’s new Blackwell processors.
→ Concerns arise over a reduced revenue forecast due to supply chain constraints in chip production.
Despite strong results, Nvidia’s stock price dipped slightly following the report. Pre-market data suggests today’s trading could start around $142.50.
What’s Next?
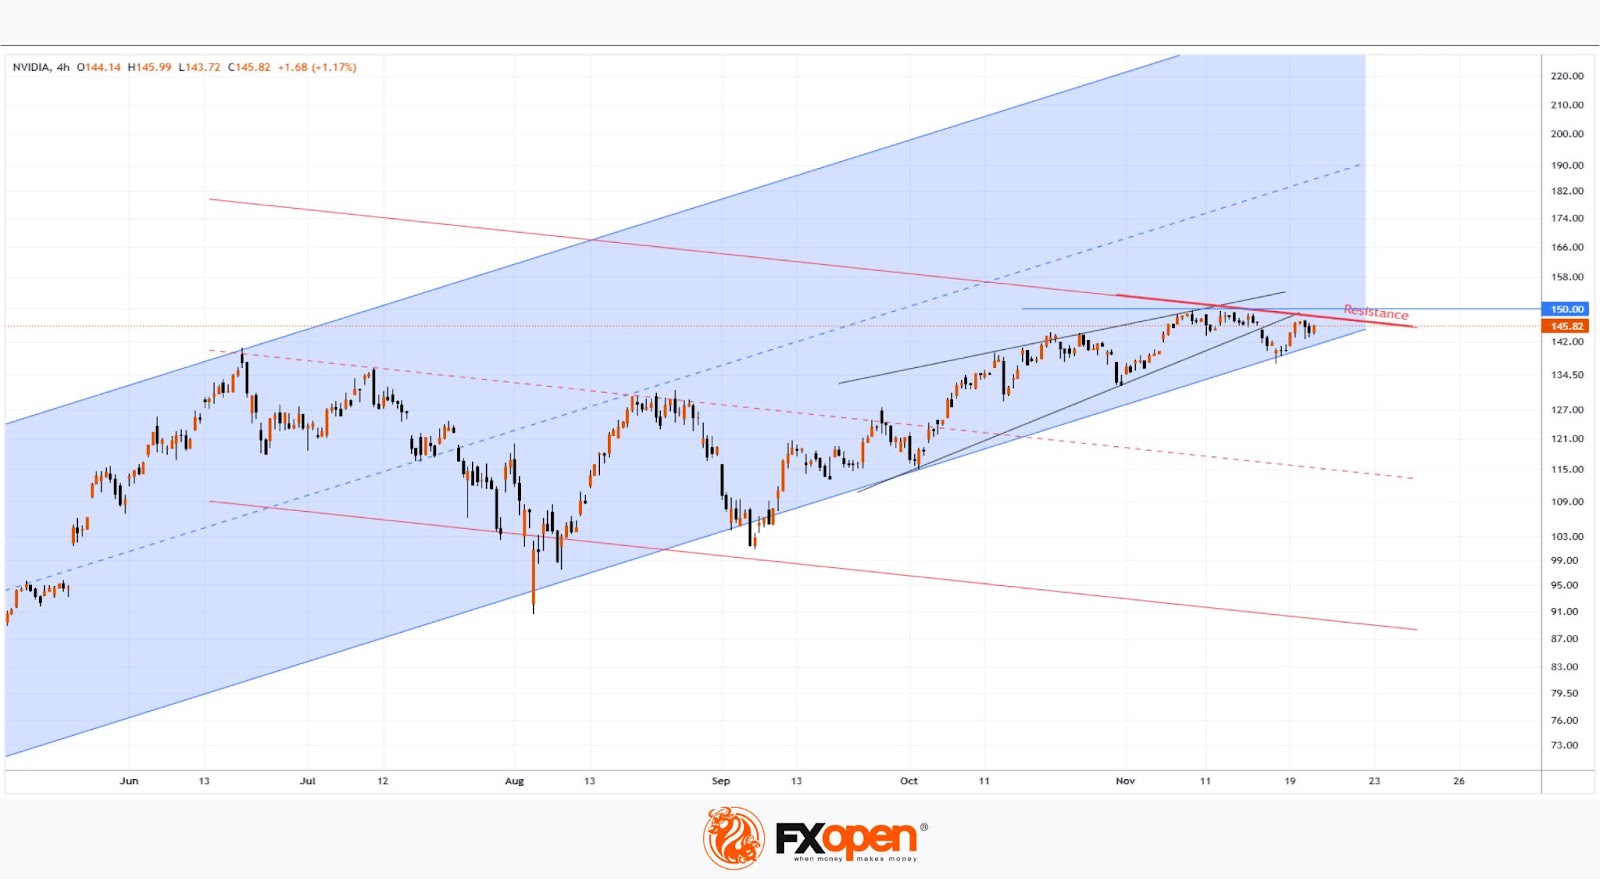
Technical analysis of Nvidia’s chart indicates potential for further downside movement, with resistance levels formed by:
→ The psychological $150 mark.
→ A Resistance line running parallel above the correction channel (July–October) at a height equal to its range.
If bearish sentiment gains momentum in today’s main session, it could:
→ Confirm a bearish breakout from the consolidation triangle.
→ Threaten a breach of the lower boundary of the long-term growth channel.
In a worst-case scenario, NVDA could shift into a bearish trend within a descending channel (marked in red).
Analyst Outlook:
According to TipRanks:
→ 39 of 42 analysts recommend buying NVDA stock.
→ The average 12-month price target is $165.
Buy and sell stocks of the world's biggest publicly-listed companies with CFDs on FXOpen’s trading platform. Open your FXOpen account now or learn more about trading share CFDs with FXOpen.
This article represents the opinion of the Companies operating under the FXOpen brand only. It is not to be construed as an offer, solicitation, or recommendation with respect to products and services provided by the Companies operating under the FXOpen brand, nor is it to be considered financial advice.
Stay ahead of the market!
Subscribe now to our mailing list and receive the latest market news and insights delivered directly to your inbox.


Latest articles

Market Analysis: GBP/USD Dips Further As EUR/GBP Regains Traction
GBP/USD failed to climb above 1.3500 and corrected some gains. EUR/GBP started a decent increase and might aim for more gains above 0.8700.
Important Takeaways for GBP/USD and EUR/GBP Analysis Today
· The British Pound


Market Insights with Gary Thomson: Oil, US Retail Sales & NFP in Focus
In this video, we’ll explore the key economic events and market trends, shaping the financial landscape. Get ready for insights into financial markets to help you navigate the week ahead. Let’s dive in!
In this episode of Market