


Nvidia (NVDA) Shares Consolidating Below $150
FXOpen

On October 22, while analysing Nvidia (NVDA) stock charts, we noted:
→ The stock had reached the $140 level;
→ A long-term ascending channel (shown in blue) was mapped;
→ Potential for price growth along the Quarter Line was suggested, dividing the lower half of the channel.
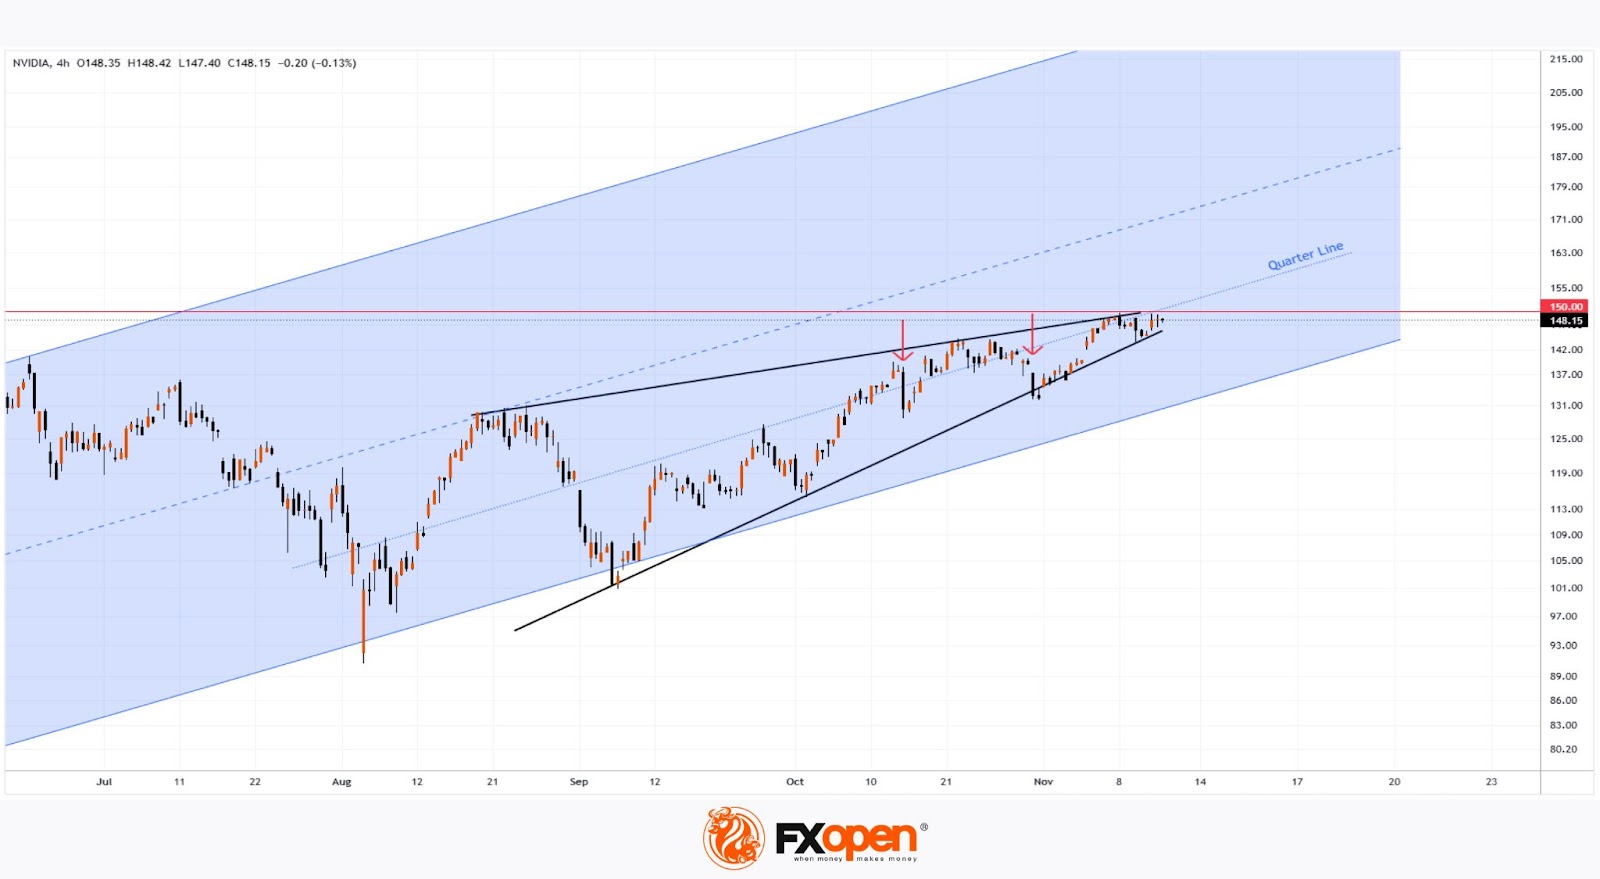
Bullish sentiment remains around Nvidia, one of the leading stocks of 2024, with the price now just below the $150 psychological mark about 29 days later. Nvidia’s technical analysis reveals that:
→ Price fluctuations are narrowing, forming a tightening triangle (illustrated with black lines), which may suggest consolidation as bulls hesitate before challenging a significant level;
→ Meanwhile, bears appear unable to gain momentum, as attempts to push prices down on wider candles (highlighted with red arrows) have not succeeded in setting a continued downtrend.
This indicates a balanced situation between demand and supply, with a slight edge for buyers. The sustainability of this buyer advantage will be tested if there’s an attempt to break above $150.
According to TipRanks:
→ 32 out of 42 analysts recommend buying NVDA stock;
→ The average price target for NVDA over the next 12 months is $157.
Buy and sell stocks of the world's biggest publicly-listed companies with CFDs on FXOpen’s trading platform. Open your FXOpen account now or learn more about trading share CFDs with FXOpen.
This article represents the opinion of the Companies operating under the FXOpen brand only. It is not to be construed as an offer, solicitation, or recommendation with respect to products and services provided by the Companies operating under the FXOpen brand, nor is it to be considered financial advice.
Stay ahead of the market!
Subscribe now to our mailing list and receive the latest market news and insights delivered directly to your inbox.


Latest articles

AUD/CAD: Months of Indecision — Is a Breakout Finally Coming?
The Australian dollar has clawed back most of its end-of-June losses, when it touched three-month lows against the greenback amid escalating Middle East tensions. Since then, sentiment has improved: the RBA's Assistant Governor Sarah Hunter signalled the board stands ready

USD/JPY: Battling at the Top of the Triangle
On 3 July, Japan's Finance Minister, Satsuki Katayama, stated that the Ministry of Finance remains in close contact with US authorities regarding developments in USD/JPY as the yen traded near its weakest level in almost 40 years. Similar verbal

Dow Jones (DJIA): Consolidation Beyond the Trend
Federal Reserve Chair Kevin Warsh testified before Congress on 14–15 July, reaffirming the Fed's commitment to bringing inflation back to target while providing no clear guidance on the future path of interest rates. Meanwhile, June inflation data came in