


FXOpen
As shown on the Nvidia (NVDA) stock chart, yesterday’s candle closed above the psychological level of $140 for the first time in history. This represents a price increase of over 186% since the beginning of 2024 and more than a ninefold rise since early 2023, following the launch of ChatGPT.
According to Benzinga:
→ Nvidia's shares continue to benefit from the surging demand for AI technologies, with hyperscalers buying its graphic chips in vast quantities to rapidly build data centres with advanced AI capabilities.
→ Nvidia’s CEO, Jensen Huang, has stated that the next-generation Blackwell GPU platform is in "insane" demand. Despite production being in full swing, the demand remains extraordinarily high.
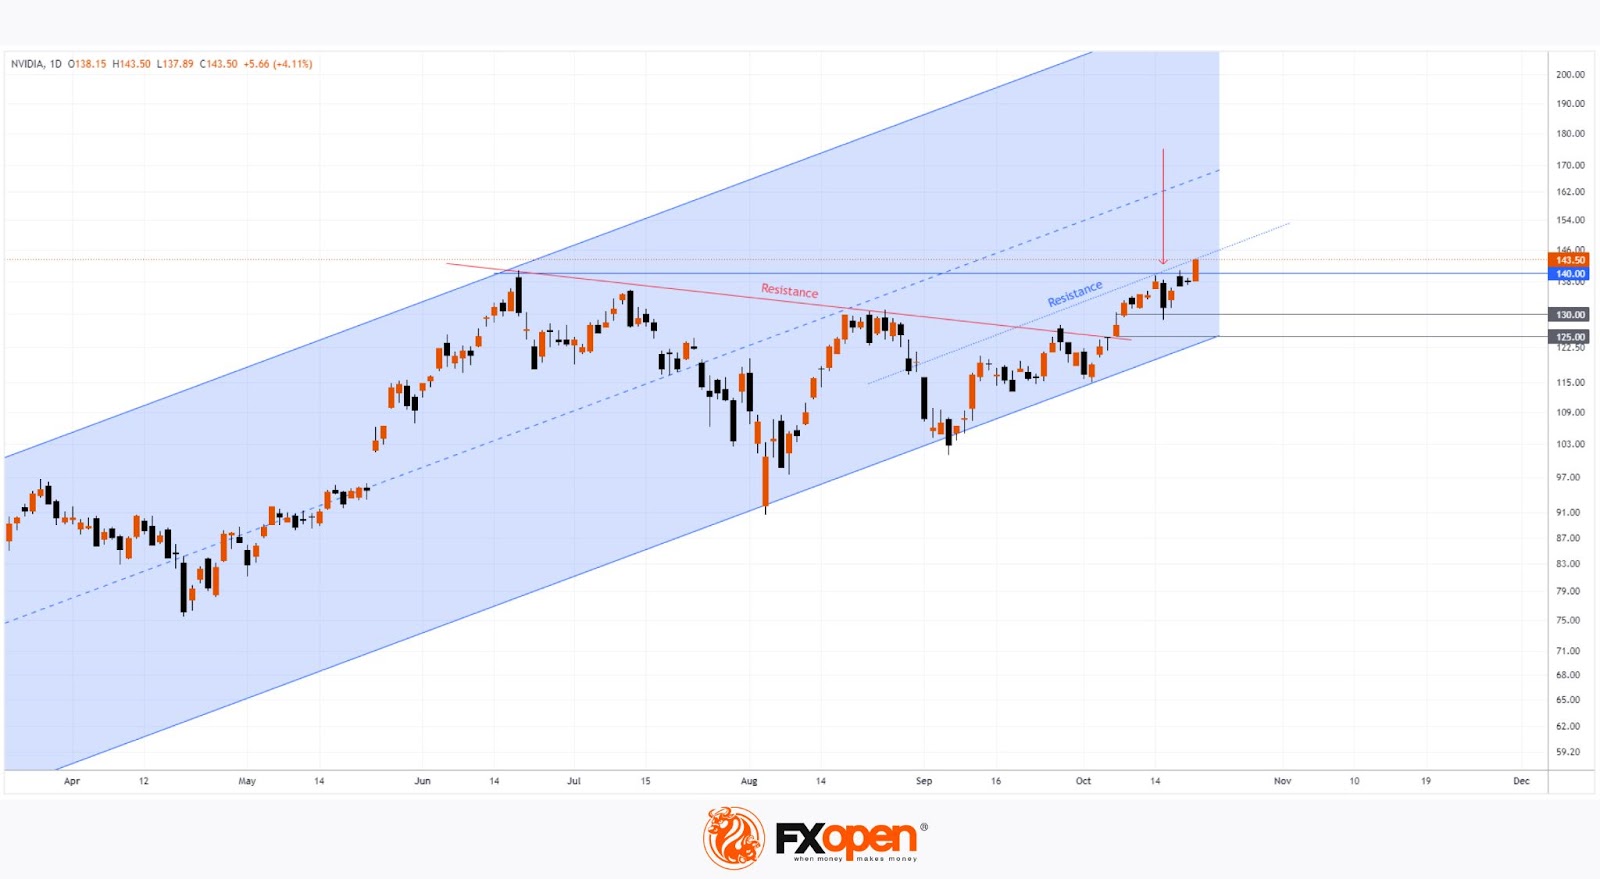
On 16 October, while analysing Nvidia’s chart, we highlighted an upward channel (marked in blue) and noted the sharp reversal from the $140 level (indicated by a red arrow). However, we anticipated support from the area linked to the strong bullish candle from 7 October. This is because:
→ The psychological levels of $130 and $125 are located here.
→ This zone showed strong demand by breaking through a four-month resistance line (red), which may now act as support.
→ There’s also a bullish Fair Value Gap on the daily chart.
Our predictions of a record high following a rebound from the $125-$130 support area were accurate, but what lies ahead?
Last week, BofA Securities analyst Vivek Arya maintained a "Buy" rating for Nvidia, raising the target price from $165 to $190 after upgrading profit forecasts for 2025 and 2026. Arya particularly noted Taiwan Semiconductor Manufacturing Company Ltd.’s strong earnings.
Indeed, the robust fundamentals suggest the upward trend (in blue) could continue, possibly leading the price along the blue Resistance line, which divides the lower half of the channel into two equal parts.
Volatility spikes in the near future could be triggered by earnings reports from Nvidia’s clients this month, including Alphabet (GOOGL), Meta Platforms (META), and Microsoft (MSFT). Nvidia's own earnings report is due on 14 November.
Read analytical NVDA price forecasts for 2024 and beyond.
Buy and sell stocks of the world's biggest publicly-listed companies with CFDs on FXOpen’s trading platform. Open your FXOpen account now or learn more about trading share CFDs with FXOpen.
This article represents the opinion of the Companies operating under the FXOpen brand only. It is not to be construed as an offer, solicitation, or recommendation with respect to products and services provided by the Companies operating under the FXOpen brand, nor is it to be considered financial advice.
Stay ahead of the market!
Subscribe now to our mailing list and receive the latest market news and insights delivered directly to your inbox.


Latest articles

Market Analysis: GBP/USD Dips Further As EUR/GBP Regains Traction
GBP/USD failed to climb above 1.3500 and corrected some gains. EUR/GBP started a decent increase and might aim for more gains above 0.8700.
Important Takeaways for GBP/USD and EUR/GBP Analysis Today
· The British Pound


Market Insights with Gary Thomson: Oil, US Retail Sales & NFP in Focus
In this video, we’ll explore the key economic events and market trends, shaping the financial landscape. Get ready for insights into financial markets to help you navigate the week ahead. Let’s dive in!
In this episode of Market