


FXOpen
Shares of Occidental Petroleum Corporation (OXY), the sixth-largest holding in Warren Buffett’s portfolio, have fallen to their lowest level since April 2022. According to Yahoo Finance, Buffett's Berkshire Hathaway increased its stake in Occidental Petroleum to nearly 30% this summer.
But could Buffett be wrong this time? As the chart shows, OXY shares have reached a 2.5-year low.
Meanwhile, analysts are lowering their price targets for OXY shares:
→ Citigroup cut its target from $65 to $62;
→ Wolfe Research reduced its target from $83 to $82;
→ Susquehanna lowered its target from $81 to $78.
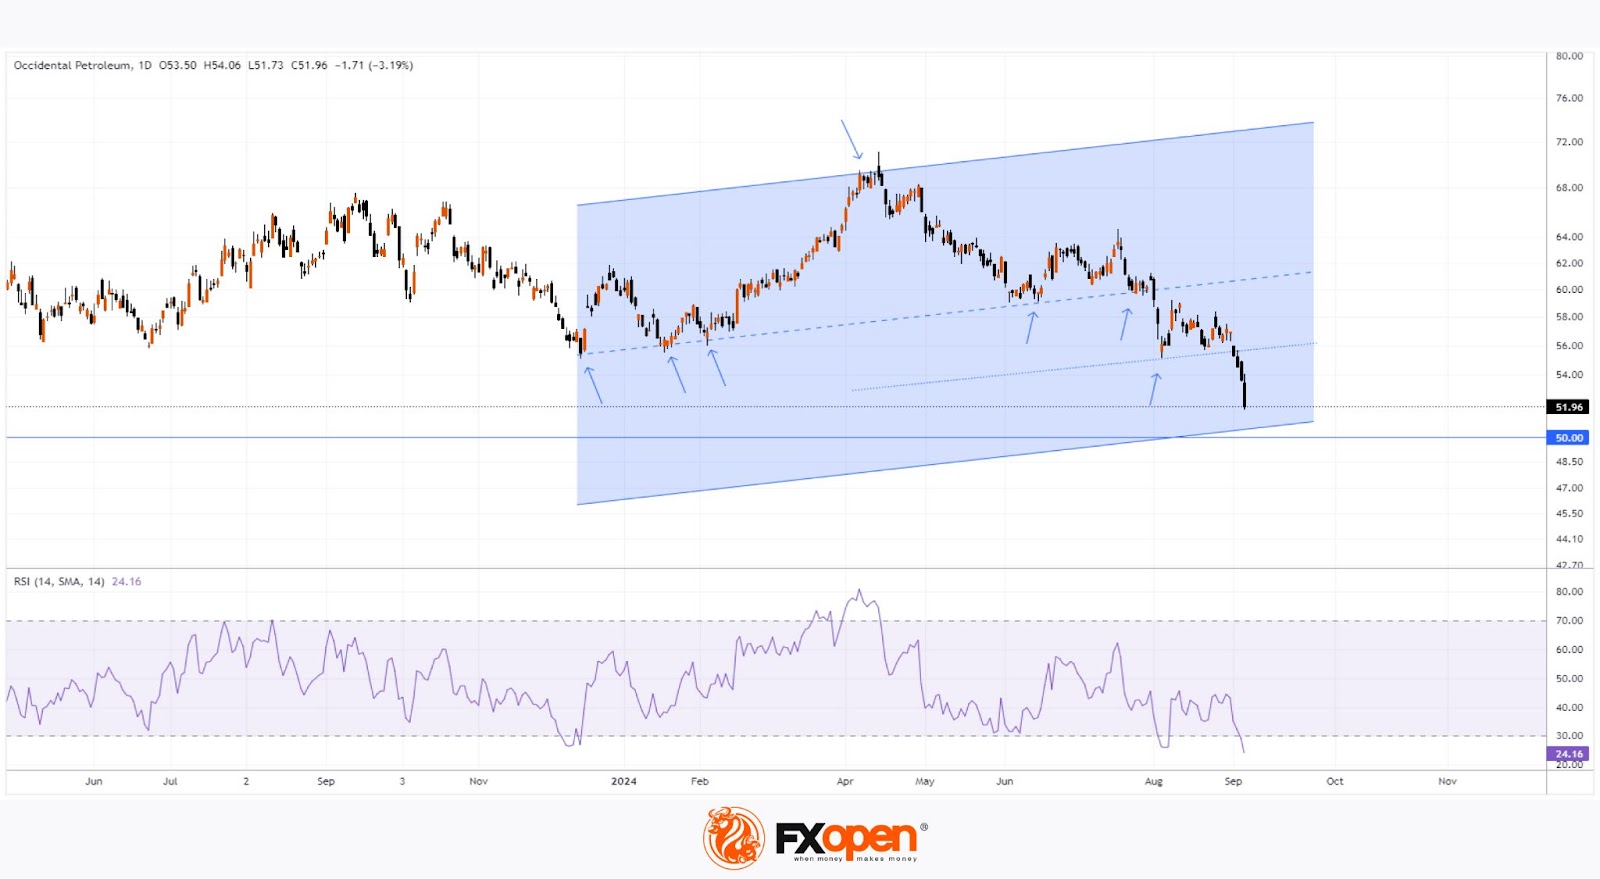
However, technical analysis suggests some reasons for bullish optimism:
→ Drawing an upward channel based on the points indicated by arrows shows that the price is nearing the lower boundary of the channel, which may provide strong support and even lead to a bullish reversal.
→ The lower boundary is further reinforced by the psychological level of $50 per share.
→ The RSI indicator is at levels last seen during the panic of spring 2020, suggesting that Occidental Petroleum (OXY) shares may be oversold and undervalued.
Buy and sell stocks of the world's biggest publicly-listed companies with CFDs on FXOpen’s trading platform. Open your FXOpen account now or learn more about trading share CFDs with FXOpen.
This article represents the opinion of the Companies operating under the FXOpen brand only. It is not to be construed as an offer, solicitation, or recommendation with respect to products and services provided by the Companies operating under the FXOpen brand, nor is it to be considered financial advice.
Stay ahead of the market!
Subscribe now to our mailing list and receive the latest market news and insights delivered directly to your inbox.


Latest articles

European Currencies Decline: Pound Hits New Lows, Euro Under Pressure
European currencies continue to weaken against the US dollar amid rising geopolitical tensions and increased demand for safe-haven and liquid assets. Market participants are reducing exposure to riskier instruments, putting pressure on both the euro and the pound. Additional support

Market Analysis: GBP/USD Dips Further As EUR/GBP Regains Traction
GBP/USD failed to climb above 1.3500 and corrected some gains. EUR/GBP started a decent increase and might aim for more gains above 0.8700.
Important Takeaways for GBP/USD and EUR/GBP Analysis Today
· The British Pound
