


FXOpen

Palantir Technologies (PLTR), a company specialising in big data analytics software, released a strong quarterly report this week:
→ Earnings per share: actual = $0.21, expected = $0.17
→ Revenue: actual = $1.181 billion (up 63% year-on-year), forecast = $1.09 billion
Palantir thus reaffirmed its status as a leader in the field of artificial intelligence. Yet, despite the impressive results, PLTR shares fell following the release. Why?
It is likely that much of the optimism had already been priced in during the company’s 150% rally earlier this year. In other words, the drop in PLTR’s share price appears to have been driven purely by market sentiment and overly high expectations, rather than any weakness in the company’s fundamentals.
Technical Analysis of Palantir Technologies (PLTR)
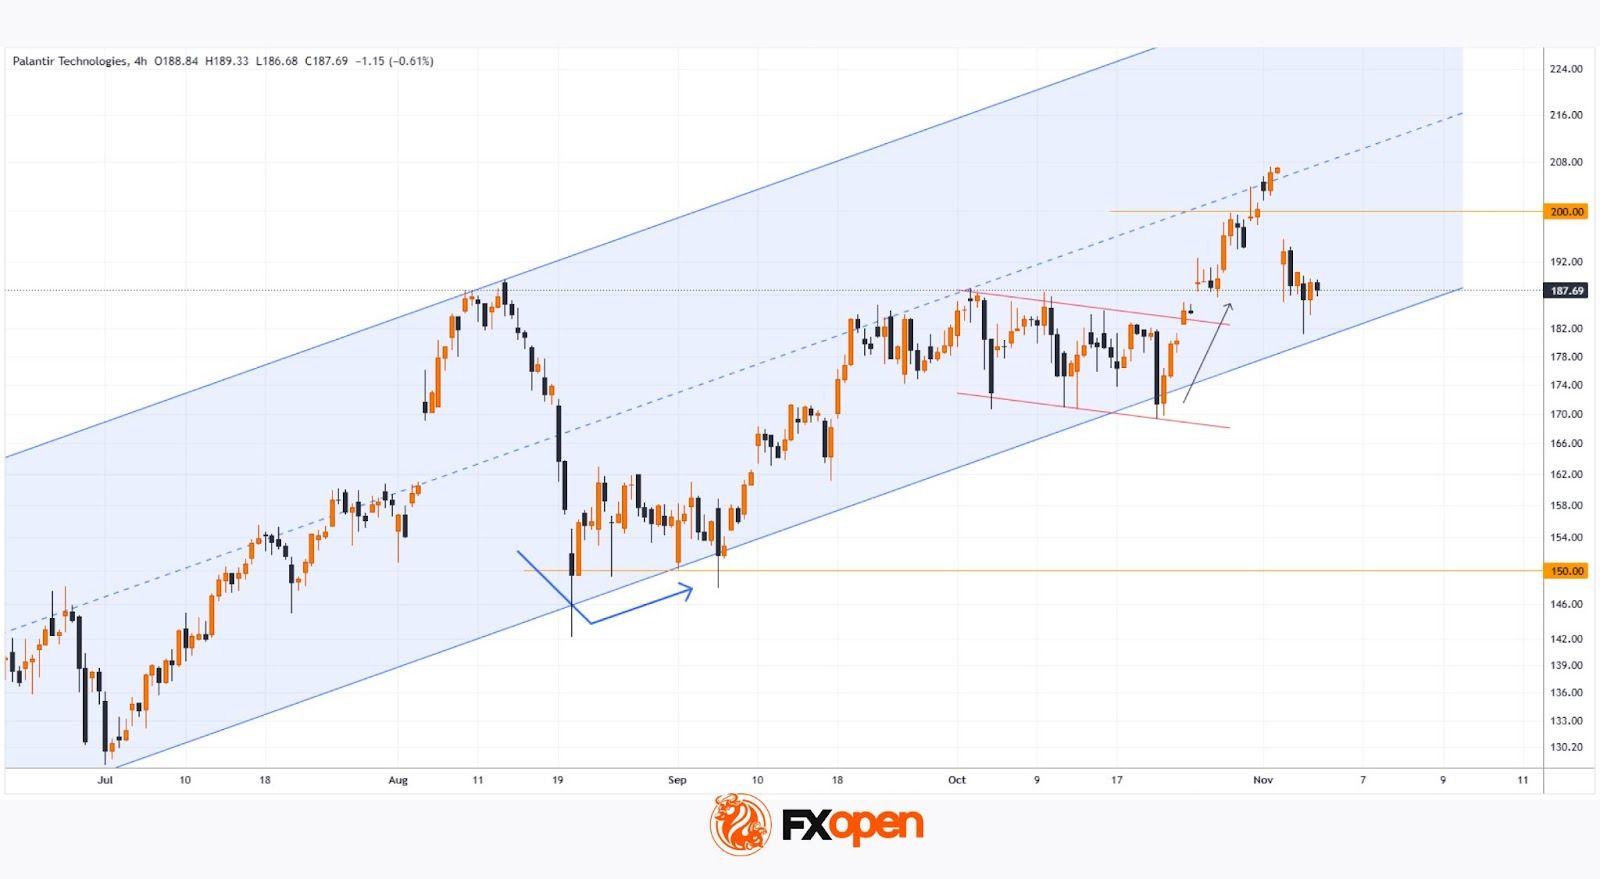
Back in August, when analysing PLTR’s price movements, we:
→ confirmed the relevance of the ascending channel (shown in blue) and highlighted support around the psychological level of $150;
→ suggested that, following a spike in volatility, the price could resume its upward trend.
As the chart’s arrow indicates, this scenario indeed played out – the lower boundary of the channel acted as strong support. Building on that level, the bulls demonstrated conviction, pushing the price through key resistance zones at $160 and $170.
In October, the price broke out of a Bullish Flag (marked by an arrow) and subsequently rose above the psychological barrier of $200.
However, the chart has since taken on a more bearish tone because:
→ the price failed to hold above $200 – creating what looks like a FOMO bull trap;
→ the median line of the channel acted as resistance;
→ following the earnings release, a bearish gap appeared in the $190–200 zone, which may now serve as future resistance.
For the bulls, much depends on whether support at the lower boundary of the channel can hold. Based on the current setup, that task looks more challenging than it was in August.
Buy and sell stocks of the world's biggest publicly-listed companies with CFDs on FXOpen’s trading platform. Open your FXOpen account now or learn more about trading share CFDs with FXOpen.
This article represents the opinion of the Companies operating under the FXOpen brand only. It is not to be construed as an offer, solicitation, or recommendation with respect to products and services provided by the Companies operating under the FXOpen brand, nor is it to be considered financial advice.
Stay ahead of the market!
Subscribe now to our mailing list and receive the latest market news and insights delivered directly to your inbox.


Latest articles

Tesla (TSLA) Shares Surge Following Musk’s Announcements
According to the chart, Tesla (TSLA) shares had been under significant pressure since the start of 2026: from their December high, they had lost around 25% of their value. The main bearish drivers included:
→ Intense competition from Chinese automakers, particularly

XTI/USD Analysis: WTI Oil Prices Under Pressure from Trump’s Statements
Yesterday, following a false bullish breakout above the psychological $100 level, WTI crude prices fell sharply towards the $85 area. The primary driver of this rapid decline was comments made by the US President.
According to Donald Trump:
→ the United
