


PepsiCo Stock Rebounds from Yearly Low Ahead of Earnings Report
FXOpen

The PepsiCo stock chart indicates:
→ Yesterday, the price dropped below $161, setting a new low for 2024.
→ However, by the end of the trading day, the price rose above $163.3, closing near the day's high.
This bullish intraday behaviour might suggest positive sentiment emerging ahead of today's earnings report.
According to Dow Jones Newswires:
→ PepsiCo's management anticipates organic revenue growth of 4% and an 8% increase in earnings per share in 2024.
→ The consensus among analysts tracked by FactSet is a 3% rise in sales and a 7% increase in earnings.
PepsiCo's stock has fallen by 9% over the past two months. Investors are concerned that demand might suffer due to rising prices from inflation and the growing popularity of weight-loss drugs, which could curb people's cravings for snacks and sugary drinks.
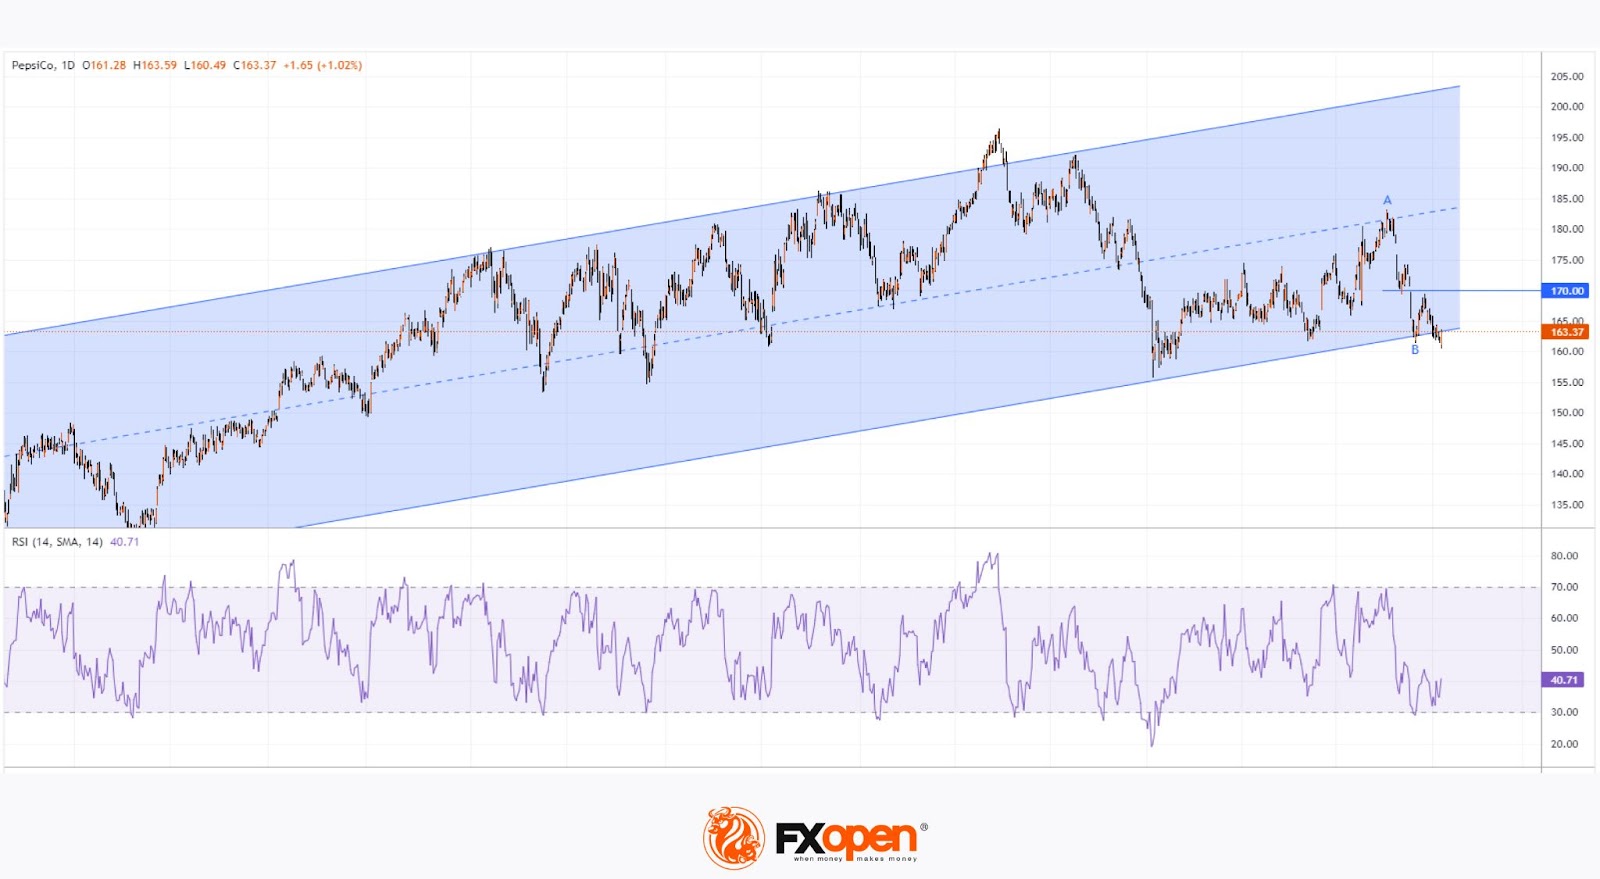
Technical Analysis of the PEP Daily Chart Today Shows:
→ In the long term, the PEP price is in an uptrend (shown in blue).
→ The price decline from the May high (point A) has brought the price to the lower boundary of this channel, suggesting a potential buying opportunity.
→ The RSI indicator at point B (13 June) fell into the oversold zone, and yesterday's price action might be forming a bullish divergence.
Today's earnings report will provide more clarity. If investors see strong sales results, the PEP stock price might receive a bullish boost. In such a case, resistance could be encountered around the $170 level.
According to TipRanks analysts' forecast monitoring, the average target price for PEP stock is $187.40, representing a 14.55% increase from current levels in the next 12 months.
Buy and sell stocks of the world's biggest publicly-listed companies with CFDs on FXOpen’s trading platform. Open your FXOpen account now or learn more about trading share CFDs with FXOpen.
This article represents the opinion of the Companies operating under the FXOpen brand only. It is not to be construed as an offer, solicitation, or recommendation with respect to products and services provided by the Companies operating under the FXOpen brand, nor is it to be considered financial advice.
Stay ahead of the market!
Subscribe now to our mailing list and receive the latest market news and insights delivered directly to your inbox.


Latest articles

AI Valuations Are Back in the Spotlight
Artificial intelligence remains the dominant investment theme of 2026, but investors are increasingly questioning whether AI stock valuations are keeping pace with reality.
💰 Big Tech continues to invest at an unprecedented scale, with hyperscaler AI spending projected to exceed $800

AUD/CAD: Months of Indecision — Is a Breakout Finally Coming?
The Australian dollar has clawed back most of its end-of-June losses, when it touched three-month lows against the greenback amid escalating Middle East tensions. Since then, sentiment has improved: the RBA's Assistant Governor Sarah Hunter signalled the board stands ready

USD/JPY: Battling at the Top of the Triangle
On 3 July, Japan's Finance Minister, Satsuki Katayama, stated that the Ministry of Finance remains in close contact with US authorities regarding developments in USD/JPY as the yen traded near its weakest level in almost 40 years. Similar verbal