


FXOpen
The Consumer Price Index (CPI) report for the UK was released today, showing that inflation is decreasing at a faster rate than analysts had predicted. According to data from ForexFactory:
→ Yearly CPI: actual = 1.7%, forecast = 1.9%, previous = 2.2%;
→ Yearly Core CPI: actual = 3.2%, forecast = 3.4%, previous = 3.6%.
The currency market responded with a decline in the pound sterling against other currencies. Traders likely assume that the Bank of England now has stronger reasons to consider easing its current monetary policy, aimed at curbing inflation.
Specifically, the GBP/USD rate fell to its lowest in nearly two months.
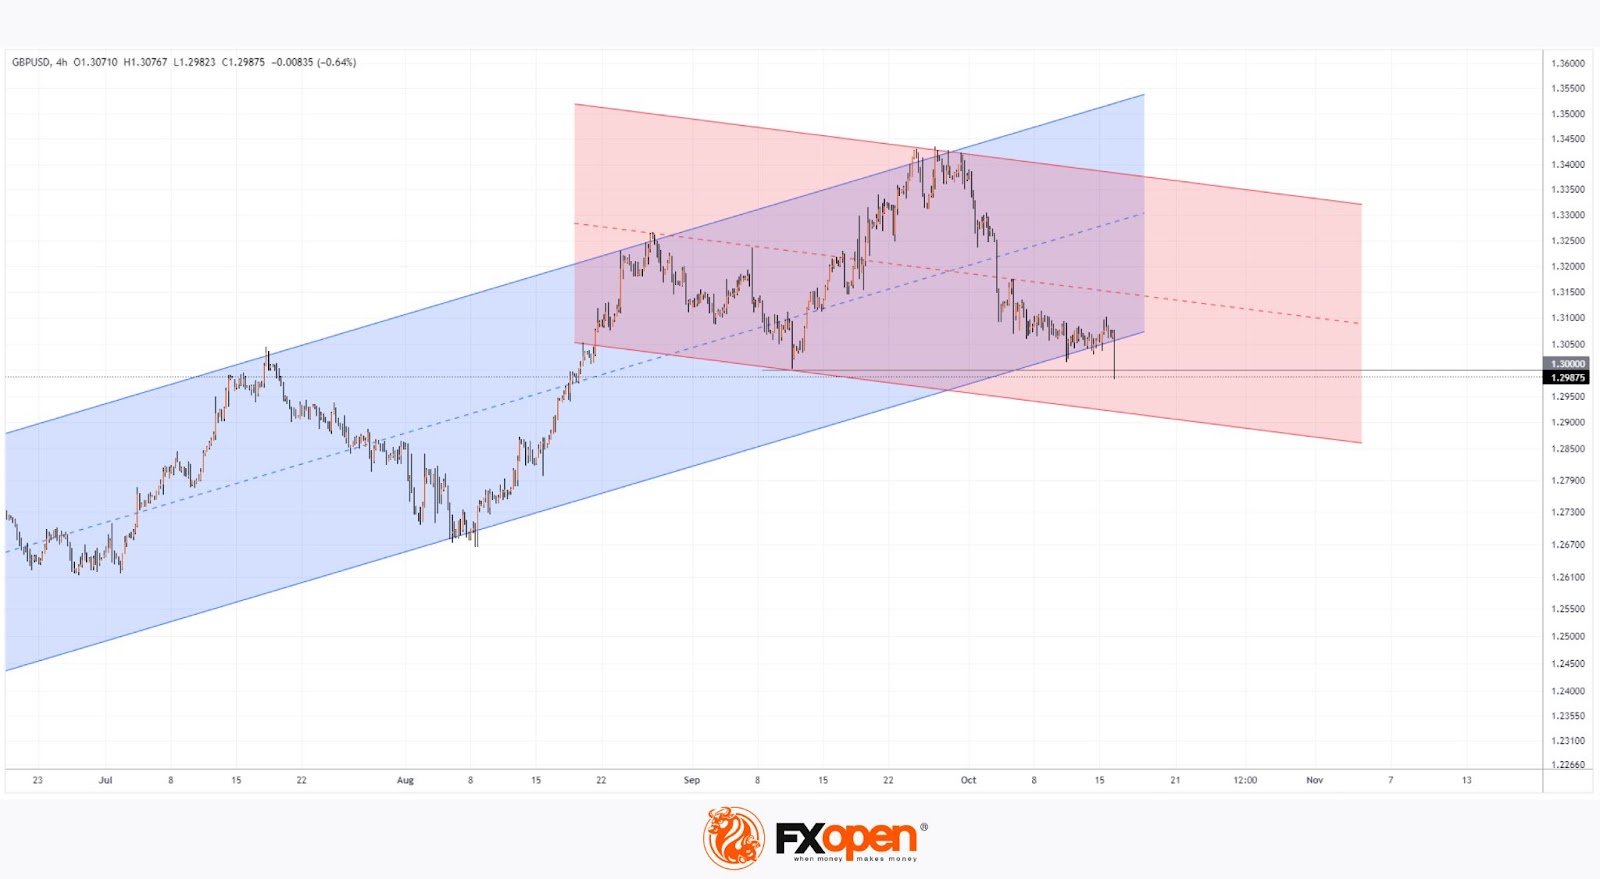
Technical analysis of the GBP/USD chart shows that:
→ The price dropped below the psychological level of 1.3000;
→ It fell beneath the lower boundary of the ascending channel (shown in blue), which had been relevant since May 2024. Resistance could be expected after breaking this line.
Bearish momentum may extend into the US trading session. It is possible that the GBP/USD rate could drop further to 1.2900, where the lower boundary of a developing descending channel is becoming clearer on the GBP/USD chart today.
Trade over 50 forex markets 24 hours a day with FXOpen. Take advantage of low commissions, deep liquidity, and spreads from 0.0 pips (additional fees may apply). Open your FXOpen account now or learn more about trading forex with FXOpen.
This article represents the opinion of the Companies operating under the FXOpen brand only. It is not to be construed as an offer, solicitation, or recommendation with respect to products and services provided by the Companies operating under the FXOpen brand, nor is it to be considered financial advice.
Stay ahead of the market!
Subscribe now to our mailing list and receive the latest market news and insights delivered directly to your inbox.


Latest articles

Market Analysis: GBP/USD Dips Further As EUR/GBP Regains Traction
GBP/USD failed to climb above 1.3500 and corrected some gains. EUR/GBP started a decent increase and might aim for more gains above 0.8700.
Important Takeaways for GBP/USD and EUR/GBP Analysis Today
· The British Pound


Market Insights with Gary Thomson: Oil, US Retail Sales & NFP in Focus
In this video, we’ll explore the key economic events and market trends, shaping the financial landscape. Get ready for insights into financial markets to help you navigate the week ahead. Let’s dive in!
In this episode of Market