


FXOpen

As shown on the XAU/USD chart, this morning the price of gold exceeded $2360 per ounce (approximately +1.5% since the start of the week).
According to Reuters, the increase in the price of gold was driven by:
→ Rising geopolitical tensions in the Middle East.
Hezbollah leader Sayyed Hassan Nasrallah warns of an "all-out war" if Israel launches a full-scale invasion against the Lebanese militia after concluding a military cooperation agreement with Cyprus, with Cyprus potentially becoming a target for Hezbollah.
→ Expectations of a decrease in Fed interest rates.
ANZ Research analysts note that the latest US economic data has shown improved conditions for the Fed to lower rates. High rates typically reduce the attractiveness of gold bars, which do not generate income.
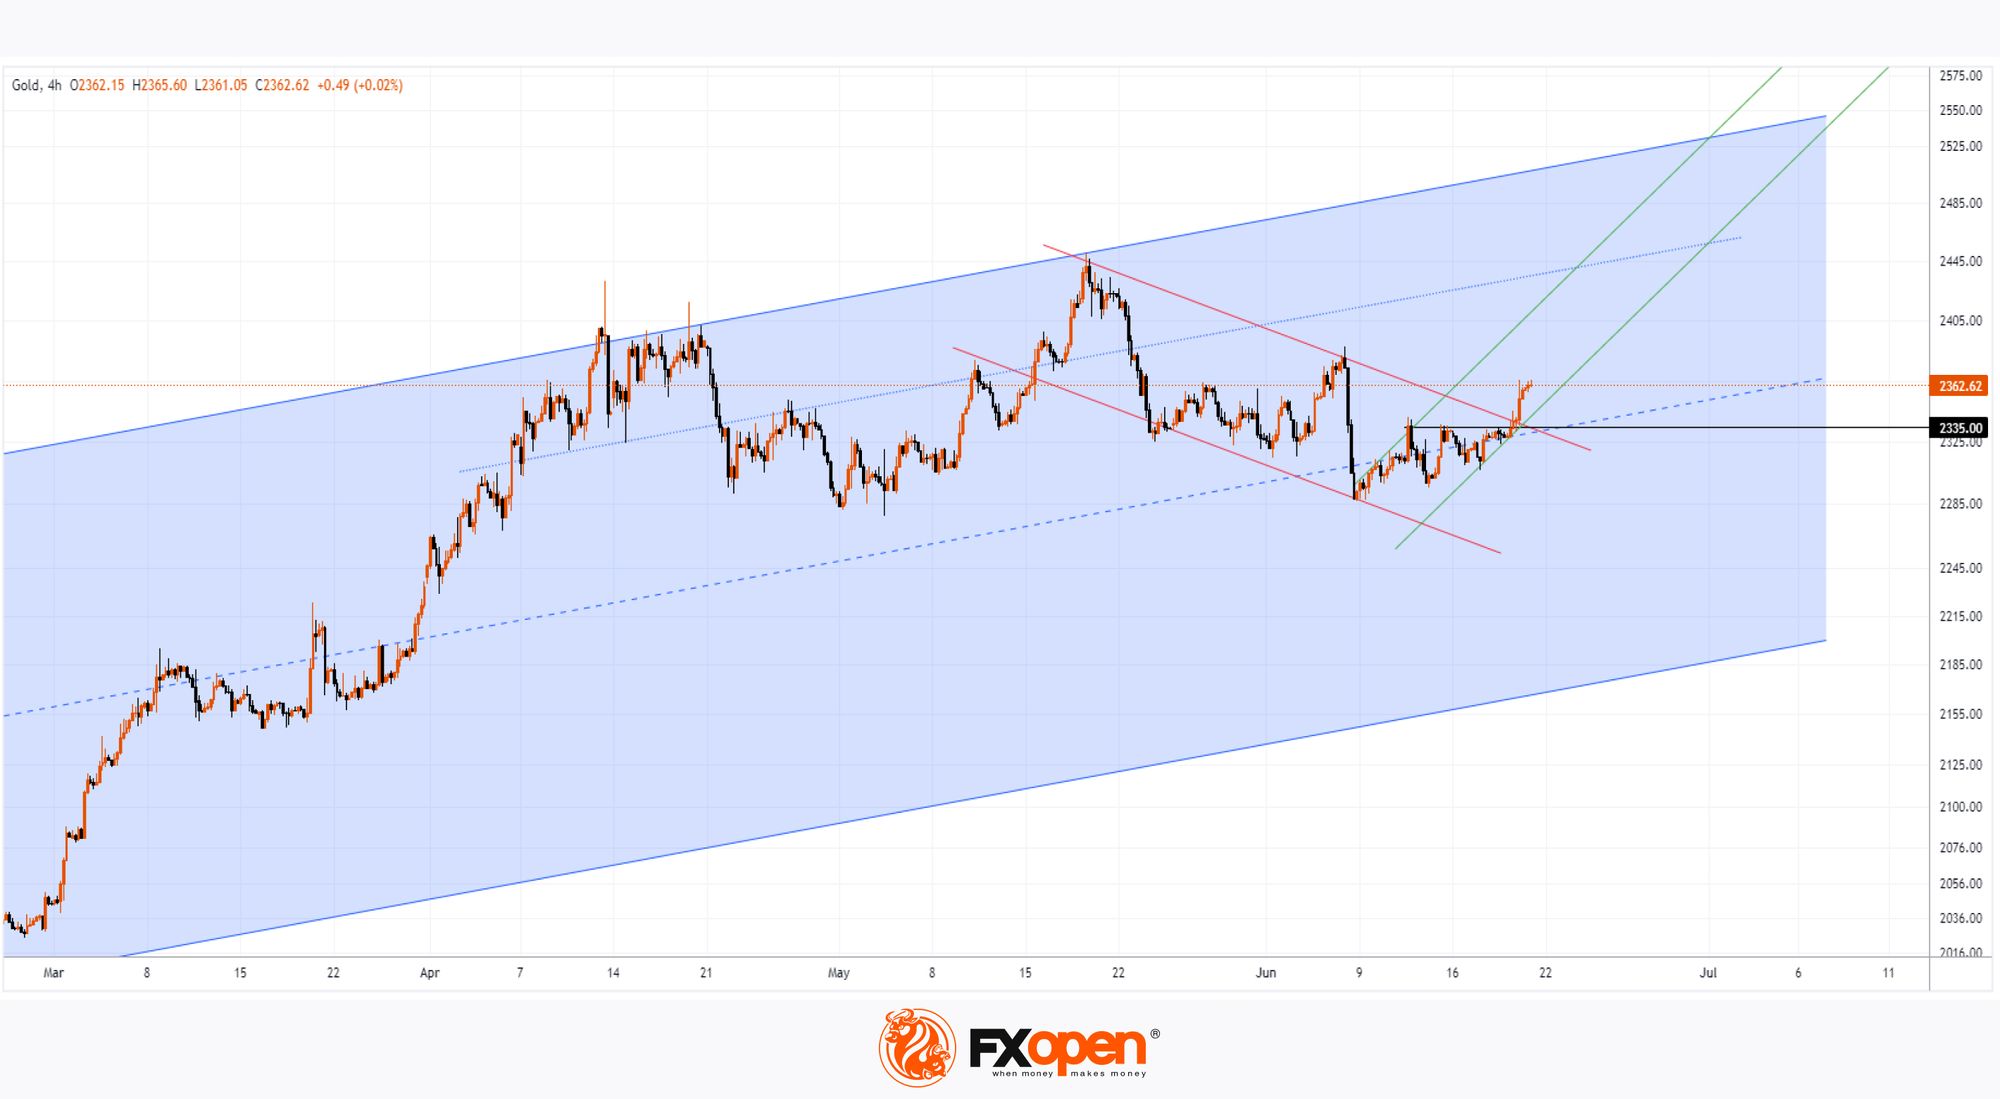
Technical analysis of the XAU/USD chart today provides more valuable information:
→ Having formed a historical high around $2450 on 20th May (which turned out to be a false breakout of the previous high on 12th February), the price of gold entered a correction (shown by the red channel), dropping below $2300.
→ In mid-June, the price of gold fluctuated around the median line of the large ascending channel (shown in blue), which began in October 2023. These diminishing fluctuations around $2313 indicated a temporary equilibrium between supply and demand.
→ The current rise is breaking through both the local resistance at $2335 and the upper red correction line, suggesting that the balance has shifted in favour of the bulls.
It is possible that the rise in the price of gold may attract new buyers, forming a sustainable upward trend on the XAU/USD chart – for example, by creating a channel (shown in green).
Read analytical Gold price forecasts for 2024 and beyond.
Start trading commodity CFDs with tight spreads (additional fees may apply). Open your trading account now or learn more about trading commodity CFDs with FXOpen.
This article represents the opinion of the Companies operating under the FXOpen brand only. It is not to be construed as an offer, solicitation, or recommendation with respect to products and services provided by the Companies operating under the FXOpen brand, nor is it to be considered financial advice.
Stay ahead of the market!
Subscribe now to our mailing list and receive the latest market news and insights delivered directly to your inbox.


Latest articles

European Currencies Decline: Pound Hits New Lows, Euro Under Pressure
European currencies continue to weaken against the US dollar amid rising geopolitical tensions and increased demand for safe-haven and liquid assets. Market participants are reducing exposure to riskier instruments, putting pressure on both the euro and the pound. Additional support

Market Analysis: GBP/USD Dips Further As EUR/GBP Regains Traction
GBP/USD failed to climb above 1.3500 and corrected some gains. EUR/GBP started a decent increase and might aim for more gains above 0.8700.
Important Takeaways for GBP/USD and EUR/GBP Analysis Today
· The British Pound
