


FXOpen

On Friday, data was released showing that inflation in the US slowed down in May. According to ForexFactory, the actual monthly Core PCE Price Index was 0.1%, which matched the forecasts (last month’s PCE was 0.3%).
Reuters reports that:
→ Prices for recreational goods, as well as for vehicles, furniture, and durable household appliances, dropped significantly.
→ This news reinforced expectations that the Federal Reserve might begin to cut interest rates later this year. According to the CME FedWatch tool, market prices now indicate a 63% probability of a Fed rate cut in September, compared to a 55% probability a month ago.
Monetary policy easing should be perceived as bullish news for the market, however… While the S&P 500 index (US SPX 500 mini on FXOpen) initially rose in the hours following the publication, it dropped to the week's lows by the end of trading. This bearish market behaviour amidst positive news of slowing inflation is concerning.
Today, the price of the S&P 500 (US SPX 500 mini on FXOpen) shows that bulls are trying to recover from Friday's decline. They might be aiming to resume the upward trend that has been in place in 2024.
How successful could this be?
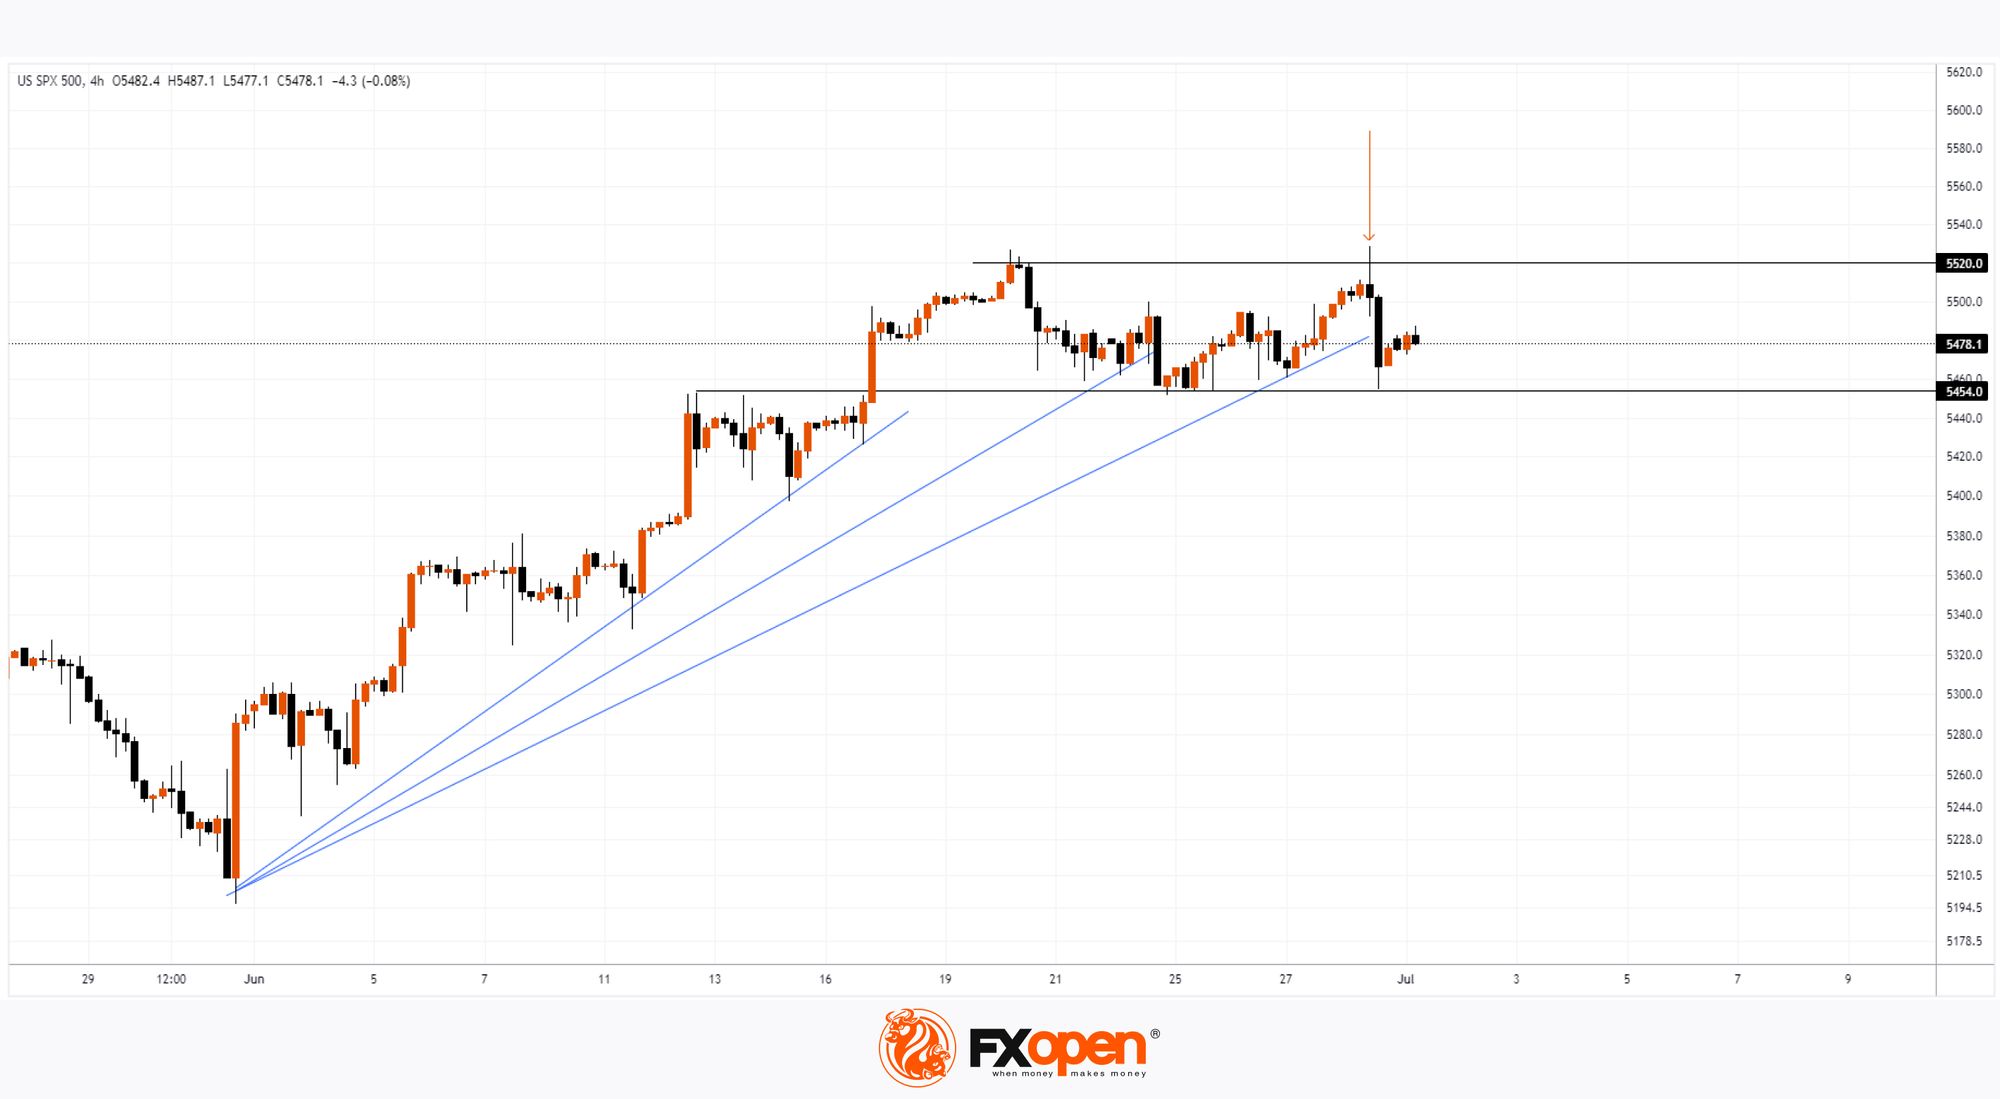
According to the technical analysis of the S&P 500 (US SPX 500 mini on FXOpen) chart:
→ The price action is forming a fan of supports (shown with blue lines) that are sequentially being broken from top to bottom. This is a sign of weakening demand.
→ On Friday, the price slightly surpassed the historical high (indicated with an arrow) but then sharply plummeted. Another bearish sign.
Currently, the price of the S&P 500 (US SPX 500 mini on FXOpen) is within the range of 5454-5520, which can be interpreted as bulls being exhausted while bears are not yet ready to push the price down. If the former do not find a fundamental incentive, it may lead to the latter taking the initiative.
Trade global index CFDs with zero commission and tight spreads (additional fees may apply). Open your FXOpen account now or learn more about trading index CFDs with FXOpen.
This article represents the opinion of the Companies operating under the FXOpen brand only. It is not to be construed as an offer, solicitation, or recommendation with respect to products and services provided by the Companies operating under the FXOpen brand, nor is it to be considered financial advice.
Stay ahead of the market!
Subscribe now to our mailing list and receive the latest market news and insights delivered directly to your inbox.


Latest articles

European Currencies Decline: Pound Hits New Lows, Euro Under Pressure
European currencies continue to weaken against the US dollar amid rising geopolitical tensions and increased demand for safe-haven and liquid assets. Market participants are reducing exposure to riskier instruments, putting pressure on both the euro and the pound. Additional support

Market Analysis: GBP/USD Dips Further As EUR/GBP Regains Traction
GBP/USD failed to climb above 1.3500 and corrected some gains. EUR/GBP started a decent increase and might aim for more gains above 0.8700.
Important Takeaways for GBP/USD and EUR/GBP Analysis Today
· The British Pound
