


Nasdaq 100: Is This the Correction Traders Have Been Waiting For?
FXOpen

The Nasdaq 100 (US Tech 100 Mini on FXOpen) remains caught between two opposing forces: cooling inflation on one side, and persistent geopolitical instability on the other. On 14 July, June's CPI print came in softer than expected, easing near-term Fed tightening bets and triggering a broad rebound across tech stocks, particularly semiconductors, which had been under heavy pressure.
That relief, however, has been repeatedly tested by renewed US-Iran hostilities, which pushed oil prices higher and lifted US Treasury yields, weighing on rate-sensitive growth names throughout the week. Every attempt at recovery has coincided with a brief easing of tensions, only for fresh escalations to reintroduce volatility days later.
Beneath the surface, semiconductors remain the index's clearest fault line: even as broader sentiment improves, doubts over the sustainability of AI-driven valuations continue to trigger selective selling in the sector. Meanwhile, SpaceX's addition to the index on 8 July has added a steady stream of passive buying, while the start of earnings season has kept investors' attention split between fundamentals and geopolitics.
Technical Analysis of the Nasdaq 100
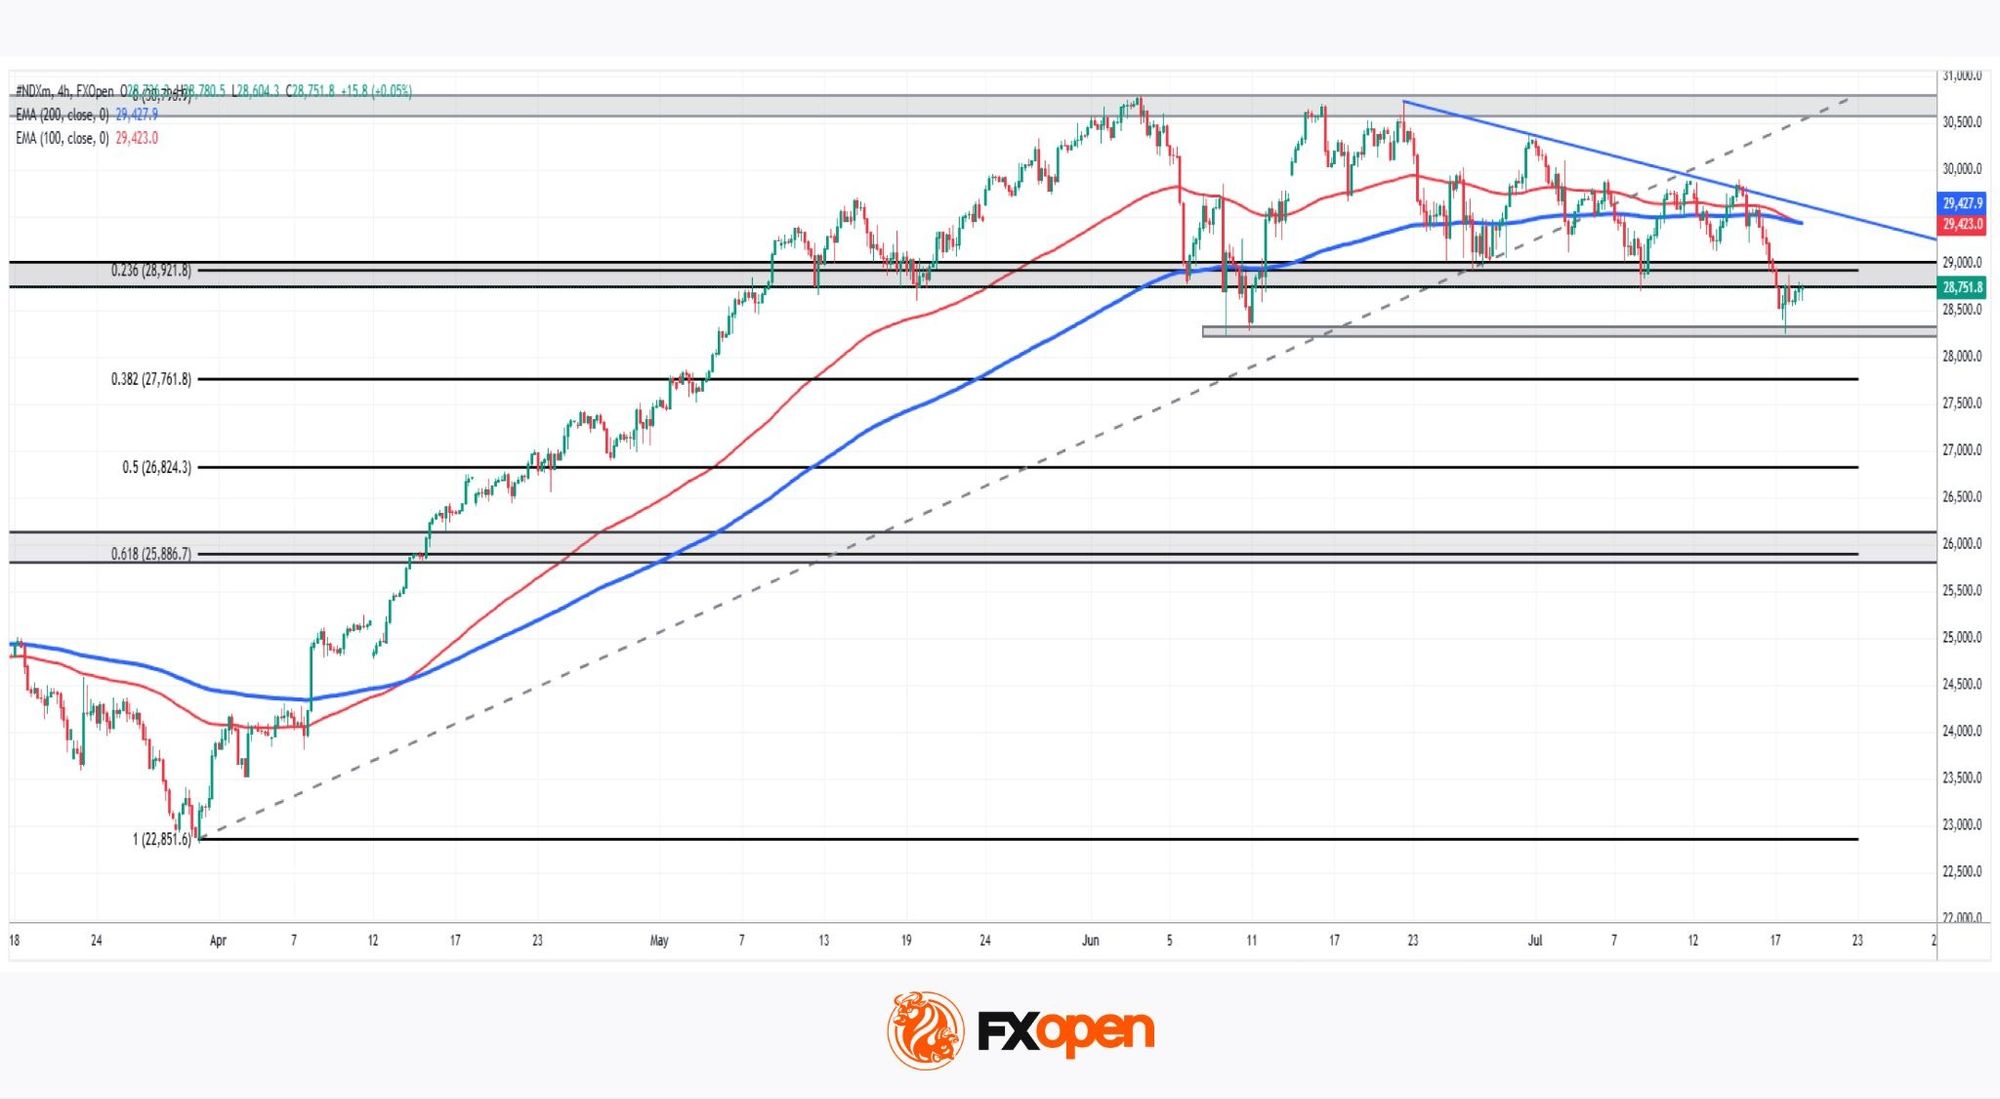
As the chart shows, after testing the 30,000 zone on three separate occasions, the Nasdaq 100 (US Tech 100 Mini on FXOpen) has struggled to build fresh momentum, entering a consolidation phase with a bearish tilt. This is clearly visible in the descending trendline that has been respected for roughly a month, alongside the index's inability to print higher highs.
Bullish Scenario
As with other risk assets, geopolitics remains the primary driver of the index's true direction. Should tensions stay contained rather than escalate further, the Nasdaq has room to extend its recovery. Technically, price finds itself at a decisive juncture: after bouncing from the 28,200-28,300 zone, which had already acted as a floor in early June, the index now faces its first real test at the 28,800-29,000 area. This zone, a former support level now turned resistance, is the key level to watch. A confirmed breakout above it could signal renewed strength and reopen the path back into the broader 29,000-30,000 consolidation range.
Bearish Scenario
With geopolitical risk still running high, sentiment toward risk assets remains fragile. Technically, the Nasdaq 100 (US Tech 100 Mini on FXOpen) appears to have broken down from the two-month consolidation range, losing the 29,000 support in the process. The formation of the descending trendline reflects the index's failure to generate higher highs, a clear sign of underlying weakness. Adding to this picture, the 100- and 200-period EMAs on the 4H chart are now crossing—the same signal that preceded April's strong bullish reversal, this time playing out in the opposite direction.
The 29,000 resistance now holds the key to the next move. Can the Nasdaq 100 (US Tech 100 Mini on FXOpen) reclaim its footing, or is this only the beginning of the correction traders have been waiting for?
Trade global index CFDs with zero commission and tight spreads (additional fees may apply). Open your FXOpen account now or learn more about trading index CFDs with FXOpen.
This article represents the opinion of the Companies operating under the FXOpen brand only. It is not to be construed as an offer, solicitation, or recommendation with respect to products and services provided by the Companies operating under the FXOpen brand, nor is it to be considered financial advice.
Stay ahead of the market!
Subscribe now to our mailing list and receive the latest market news and insights delivered directly to your inbox.


Latest articles

CAD/JPY: The Yen's Most Historic Move in 30 Years Meets a Fragile Support
Two central banks are heading in genuinely opposite directions this week, and the tension is unmistakable. The Bank of Canada held rates steady at 2.25% on September 2, with a mildly hawkish tilt as policymakers acknowledged a broadening economic

USD/JPY and USD/CAD Await Key Fed Decision
The US dollar is consolidating against the yen and Canadian dollar ahead of the key event of the week — the Federal Reserve meeting. The Fed is widely expected to raise its policy rate by 25 basis points to a range

UnitedHealth: Fundamentals Are Healing, Now the Chart Must Agree
UnitedHealth finds itself in a genuinely split narrative right now, trading near $388, down about 15.9% from its 52-week high, even as the fundamental picture keeps improving. Q2 earnings beat expectations, with revenue of $112.03 billion, and the