


FXOpen
On September 19, we analysed the S&P 500 index, indicating that the market is under pressure. This was an important long term analysis, and let's see what has changed in a month with the news that happened yesterday.
A month ago we marked turning points A, B, C, D on the chart.
Since then, new turning points have appeared: E, F, G, H.
As we indicated, in the pulse sequence A→B, B→C, C→D, D→E, each subsequent pulse was 50% shorter than the previous one. The same observation is true for the E→F movement, which is the last in a series of contracting impulses. That is, the market either compressed into a spring or formed an important balance of supply and demand.
However, the F→G impulse violated this trend. This means that the market has left the state of balance in a bearish direction. At the same time, the channel expanded by 2 times (according to the principle of a parallel channel), and the market found new support G at its lower border. Further, it is important that the movement G→H amounted to 50% of the decline, which corresponds to a bullish corrective movement within the framework of the dominant downward trend (as you understand, the trend began when the market came out of balance).
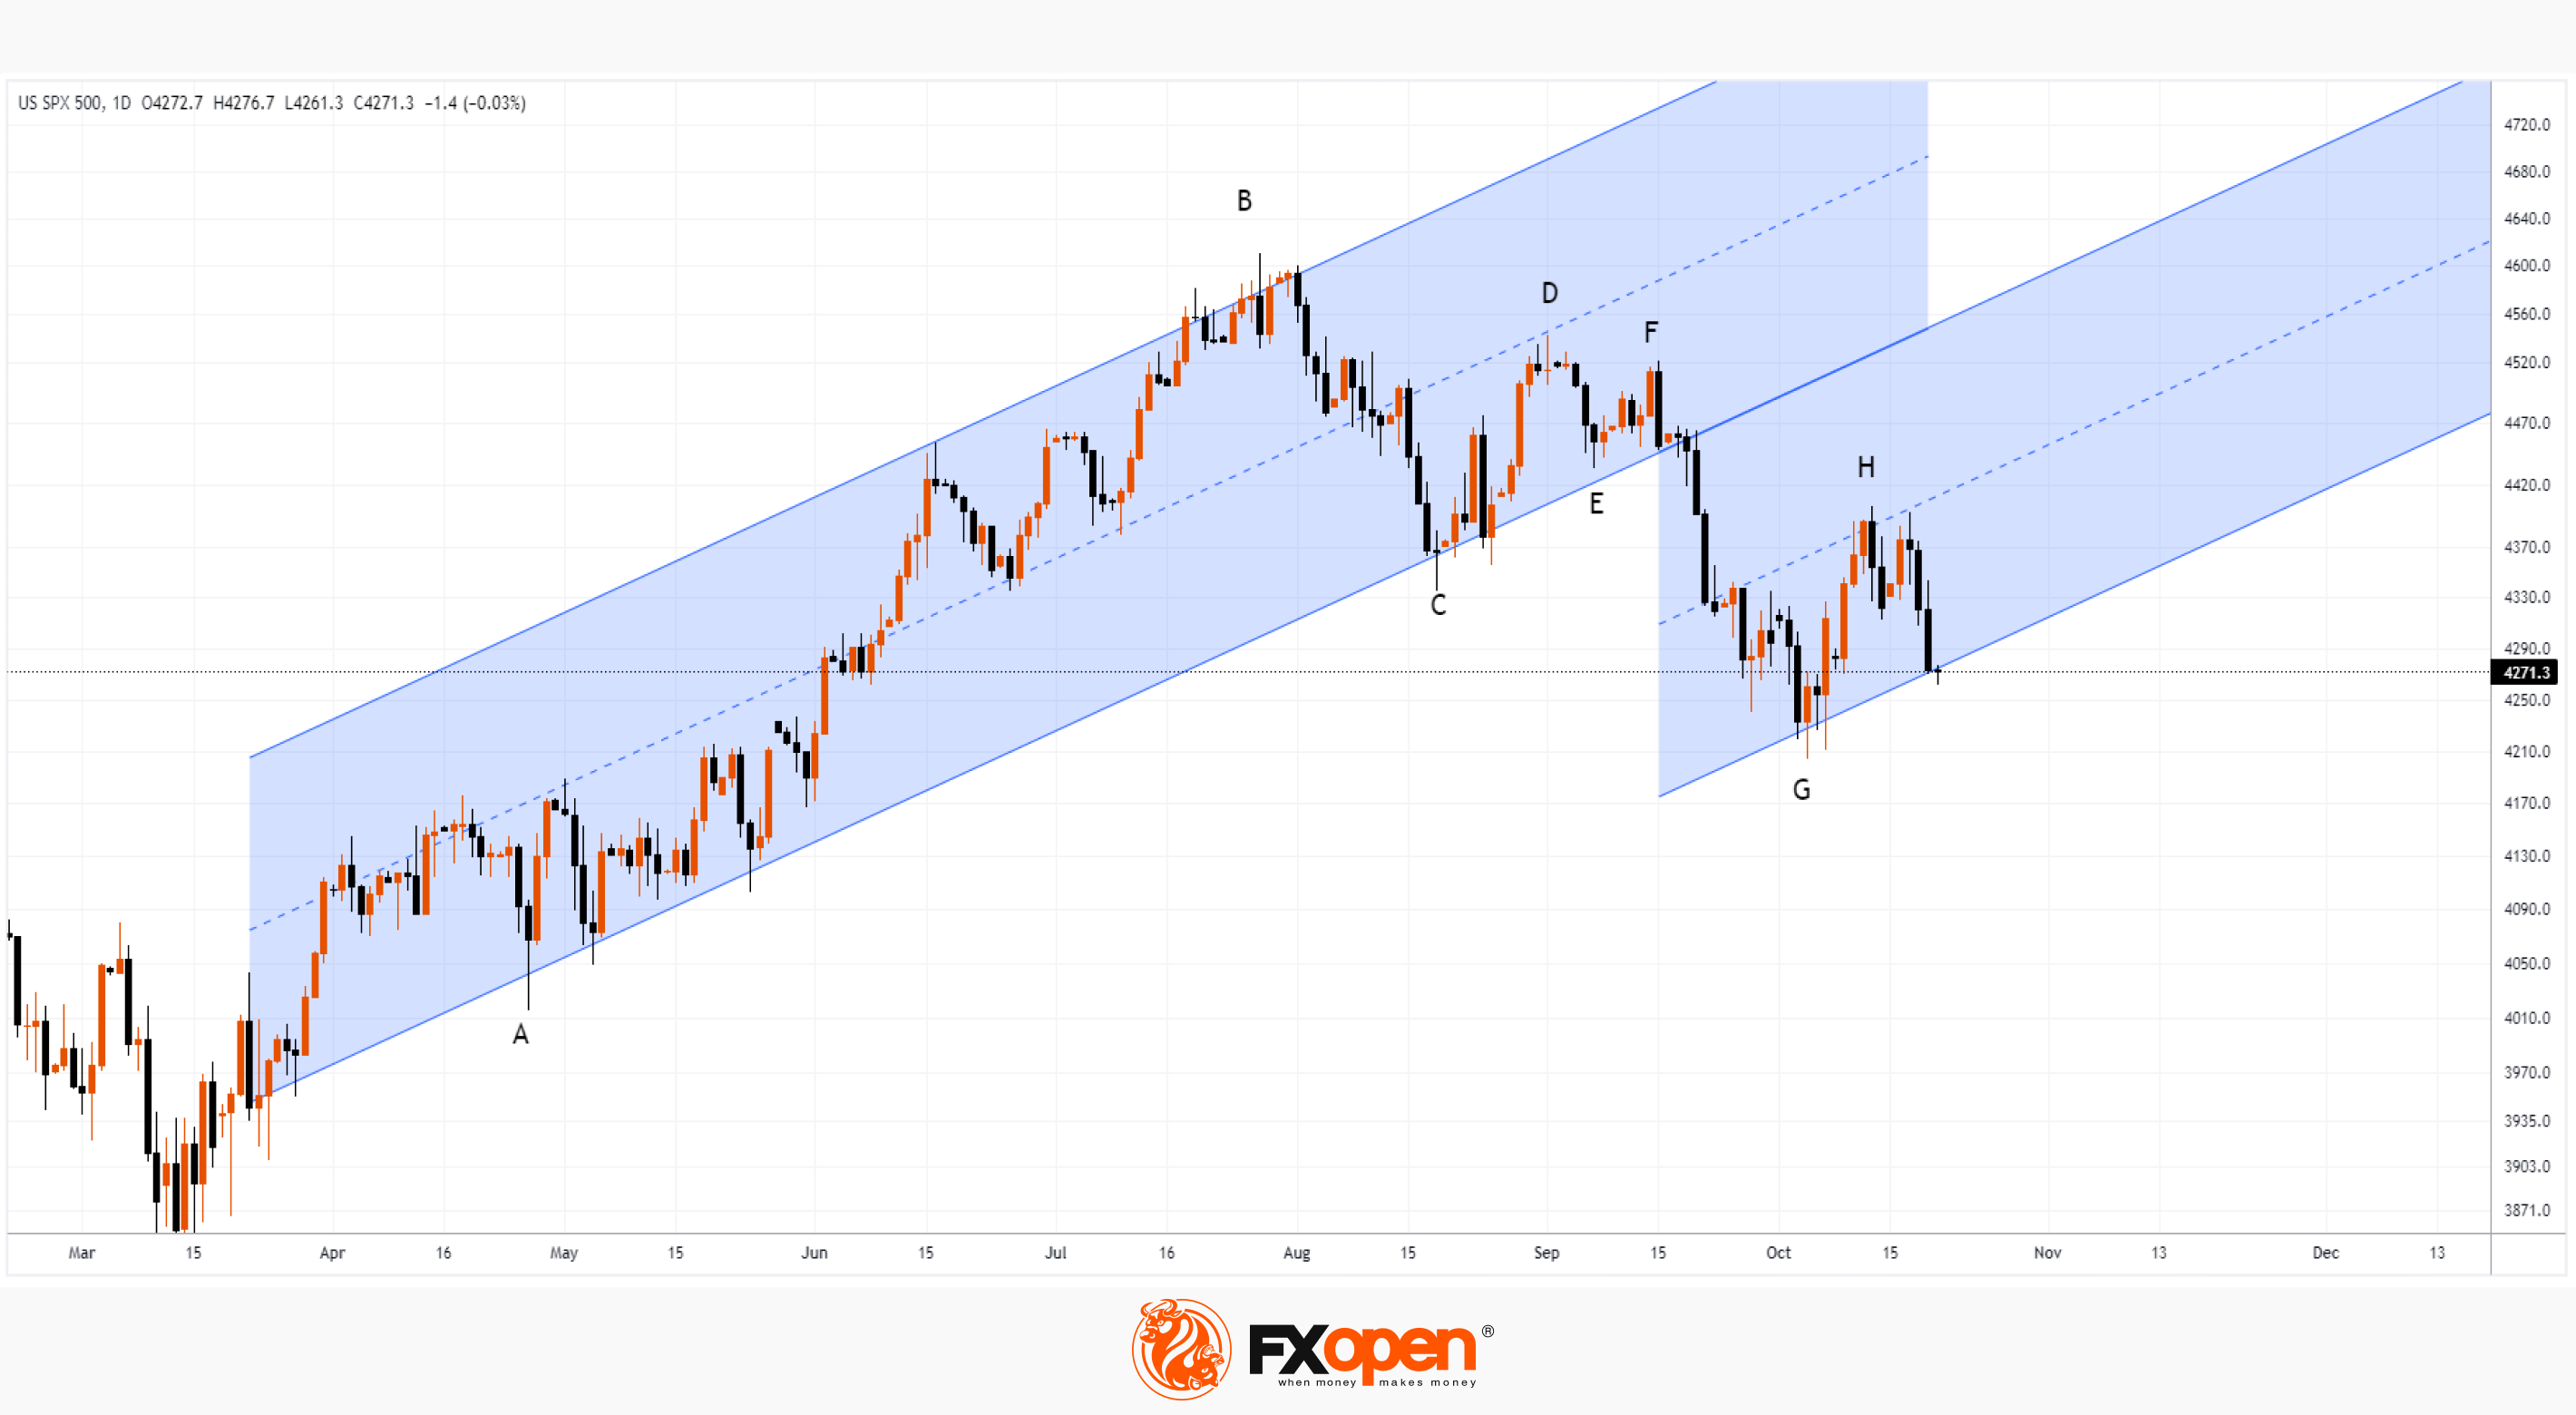
This assumes 2 basic scenarios:
- the S&P 500 index will balance around the lower boundary, which will mean fluctuations in the area of 4,250-4,350;
- the index price will develop a downward movement, breaking through important support, which, as we showed earlier, originates from the bottom of the panic associated with the spread of coronavirus in 2020.
Considering that on Wednesday and Thursday the E-mini S&P 500 futures declined with acceleration and increasing volume, the odds may be on the side of the second scenario.
This can be facilitated by:
→ fears that the United States may be drawn into the escalating military conflict in the Middle East. In a speech yesterday, President Biden said that support for Israel, like Ukraine, is important for the country's future;
→ the Fed policy with high rates. Inflation is still too high, Powell said in yesterday's speech;
→ disappointing company data during earnings season. An example is Tesla. We will soon find out how other large companies included in the index will report.
Trade global index CFDs with zero commission and tight spreads (additional fees may apply). Open your FXOpen account now or learn more about trading index CFDs with FXOpen.
This article represents the opinion of the Companies operating under the FXOpen brand only. It is not to be construed as an offer, solicitation, or recommendation with respect to products and services provided by the Companies operating under the FXOpen brand, nor is it to be considered financial advice.
Stay ahead of the market!
Subscribe now to our mailing list and receive the latest market news and insights delivered directly to your inbox.


Latest articles


XAG/USD Analysis: Silver Drops to March Low
As seen on the XAG/USD chart, the price of silver fell to the $70 level and briefly pierced it, marking the lowest level since early February.
Although geopolitical tensions typically support demand for safe-haven assets, silver is under pressure

XBR/USD Analysis: Brent Crude Rises Above $110
Yesterday, Brent crude prices moved sharply higher, with the XBR/USD chart showing breakouts above local resistance levels. Today, the price has climbed above the $110 mark, bringing it close to the multi-year high recorded on 9 March.
The bullish