


FXOpen
It is traditionally believed that the Santa Rally occurs at the end of December and the first days of January, but according to many opinions it is acceptable to think that it begins much earlier.
At the beginning of December, the values of the S&P 500 index came close to the highs of the year in the area of 4,611, but have declined to date, forming a number of bearish signs:
→ the candle on November 29 has a long upper shadow — a sign of seller activity;
→ the same can be said about yesterday’s candle;
→ candles on December 1-4 form a bearish engulfing pattern;
→ all of the listed candles form a head-and-shoulders pattern (shown by the letters SHS).
That is, the chart indicates activation of sellers near the yearly high — and this is a problem that can affect the so-called Santa Claus rally (the active channel, shown in blue, actualizes the theme associated with the rally).
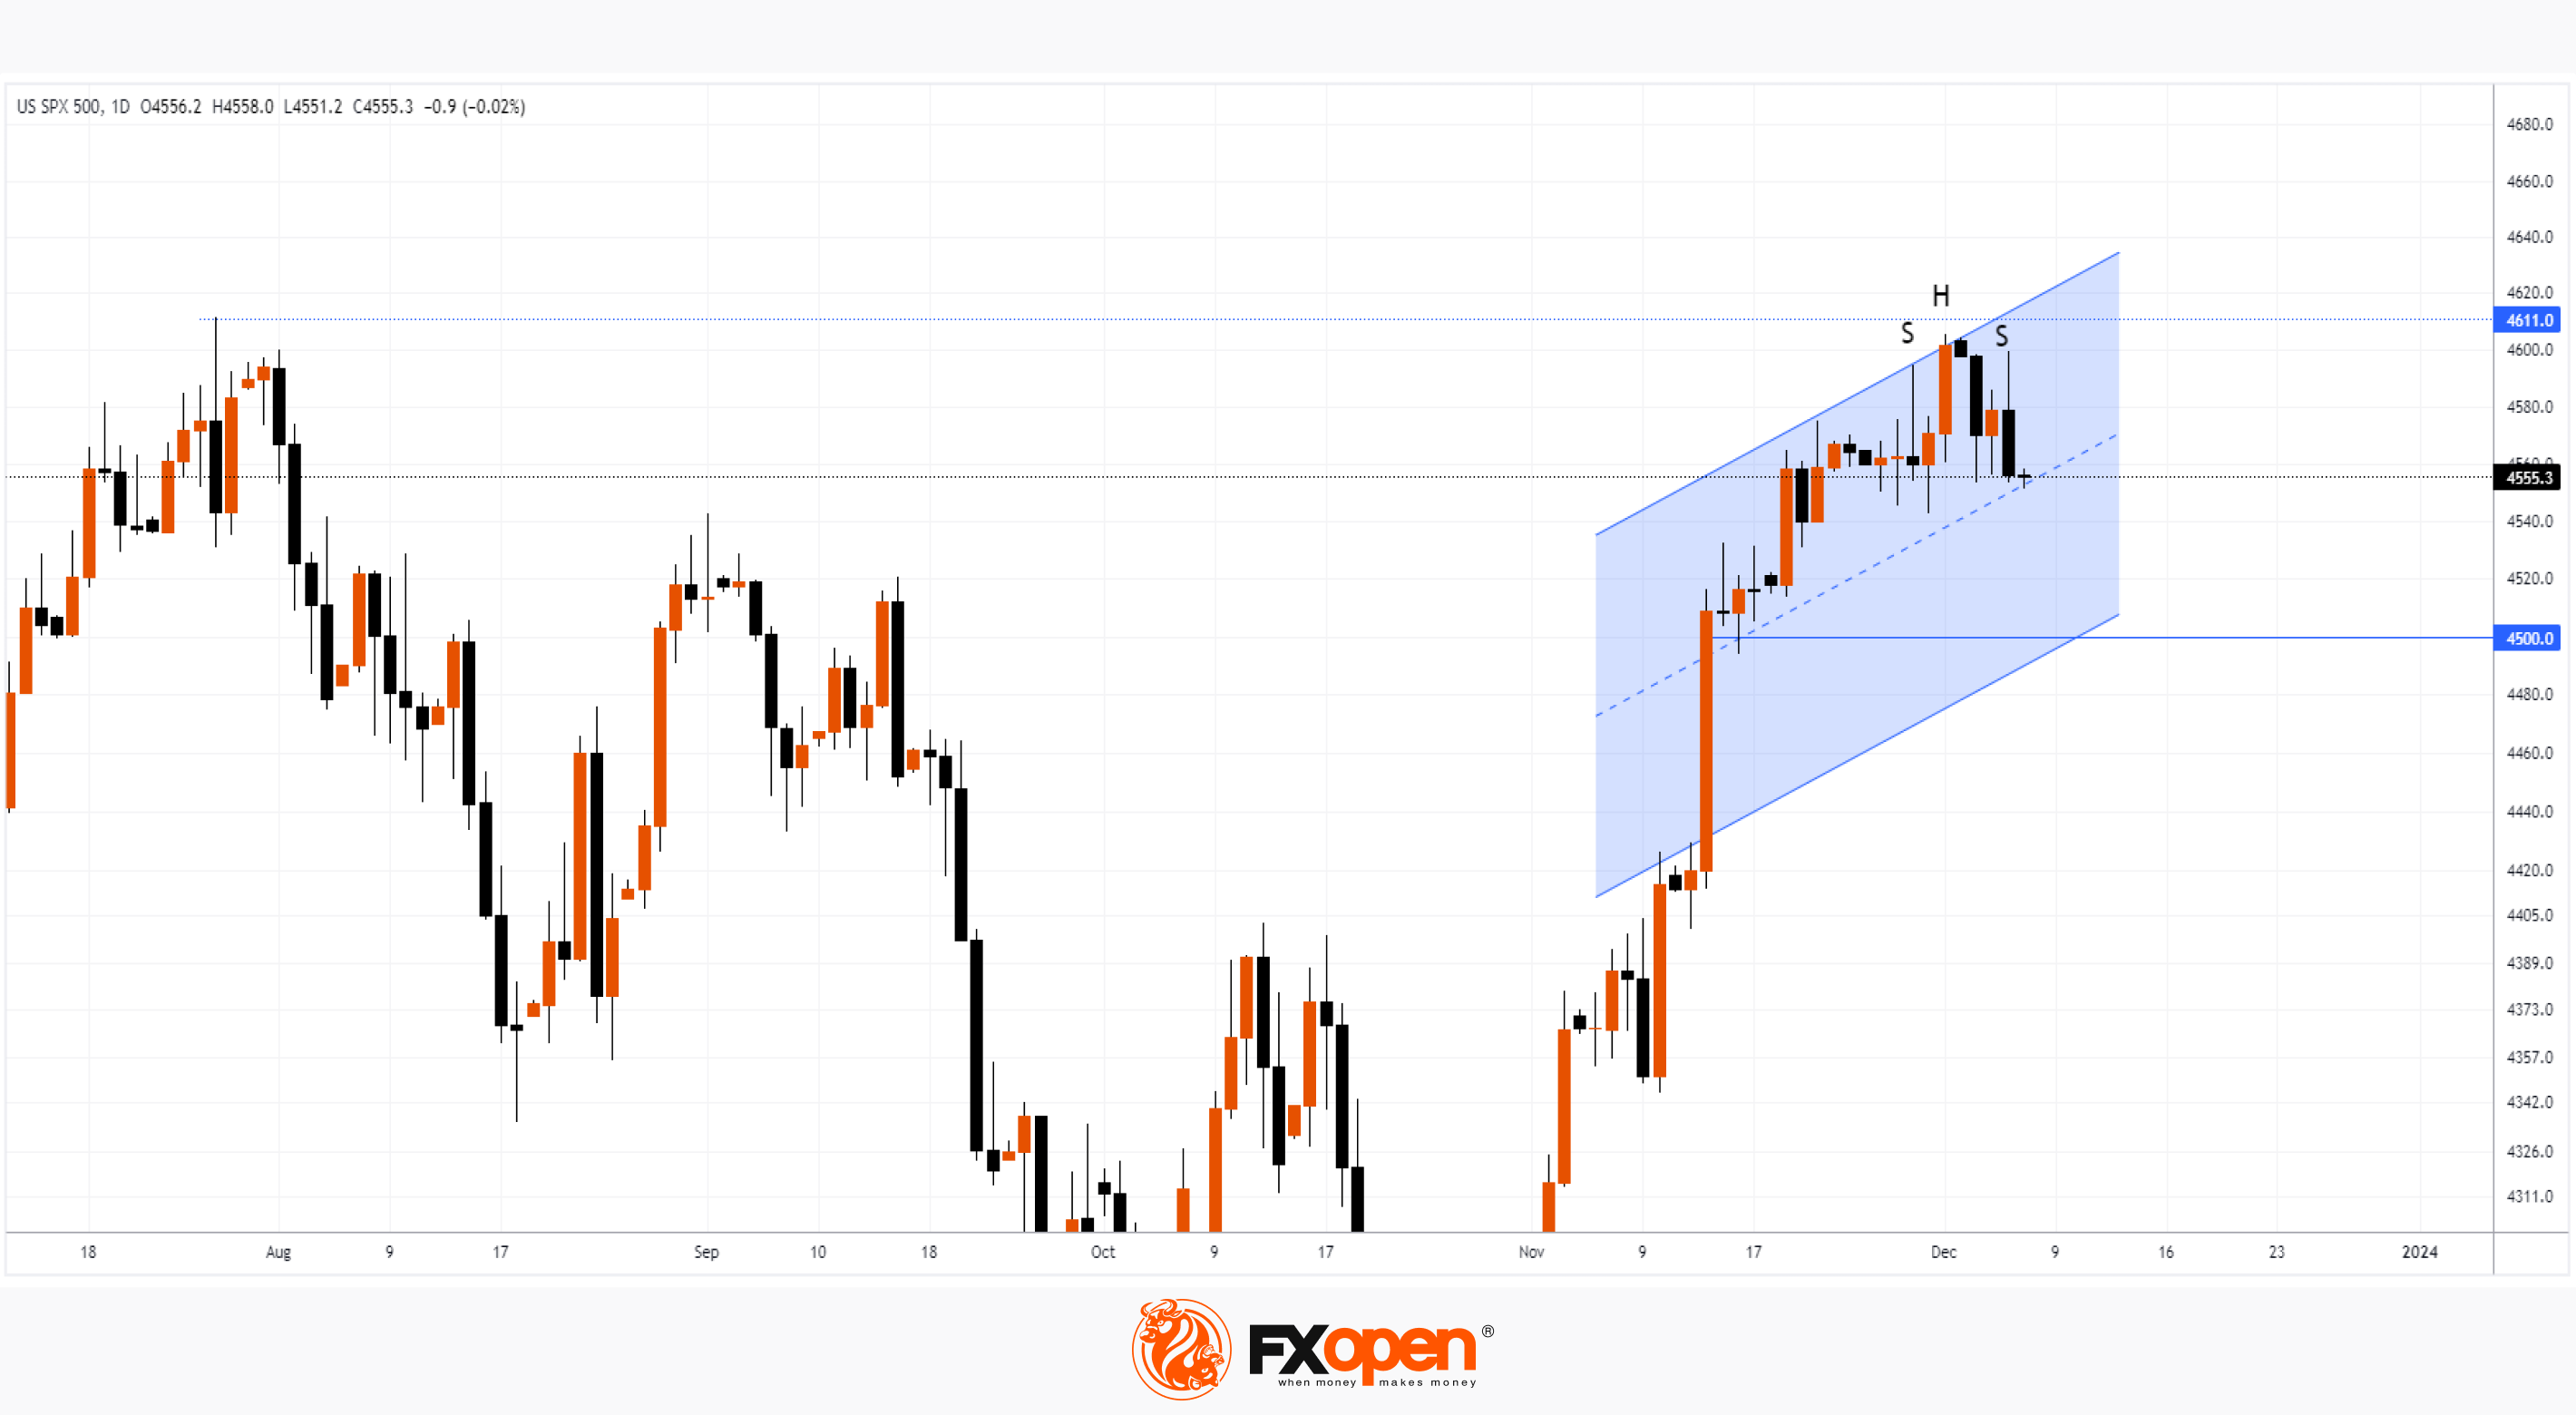
The mentioned signs of increased supply forces give reason to assume that the values of the S&P 500 index may roll back to the lower border of the parallel channel, approximately the psychological level of 4,500, which can work as support. By the way, this level already provided support during the formation of consolidation on November 15-17.
Fundamentally, tomorrow's news (issued at 16:30 GMT+3) from the US labor market could serve as a trigger for a rollback. On the other hand, it is possible that the news will give impetus to the bulls to attack the level of the year's high.
Today's session will be interesting from the point of view of the market's ability to form a rebound from the median line of the blue channel. Price action will indicate current sentiment ahead of important news.
Trade global index CFDs with zero commission and tight spreads (additional fees may apply). Open your FXOpen account now or learn more about trading index CFDs with FXOpen.
This article represents the opinion of the Companies operating under the FXOpen brand only. It is not to be construed as an offer, solicitation, or recommendation with respect to products and services provided by the Companies operating under the FXOpen brand, nor is it to be considered financial advice.
Stay ahead of the market!
Subscribe now to our mailing list and receive the latest market news and insights delivered directly to your inbox.


Latest articles

FX Markets Are Changing: What’s Driving Currencies Now?
FX markets have become increasingly reactive in March, with geopolitical developments—particularly the US–Iran conflict—driving price action across currencies, commodities, and interest rate expectations.
In this update, we examine the key forces shaping the FX market right now,

GBP/USD Rises Following Bank of England Decision
Yesterday, the Bank of England’s decision had a significant impact on the pound, which strengthened against other currencies. Although the Official Bank Rate remained unchanged at 3.75%, the market was surprised by the “hawkish” signals, which sharply contrasted

S&P 500 Analysis: Index Falls to Year-to-Date Low
As the S&P 500 chart (US SPX 500 mini on FXOpen) shows, the index dropped below the 6,570 level yesterday for the first time in 2026. As a result, the equity market may be on track to