


S&P 500 Falls from Record High in Anticipation of Key News
FXOpen

On Friday, at 15:30 GMT+3, the Core PCE Price Index values will be released – an economic indicator to which the Federal Reserve pays special attention when assessing inflation levels in the US. This event is likely to cause a surge of news in the financial markets, and its anticipation will influence sentiments throughout the week.
On Monday morning, the S&P 500 Index (US SPX 500 mini on FXOpen) fell to 5465 points after a historical record above 5500 points was set on June 20th. The decline was contributed by Friday’s report from the National Association of Realtors, which showed a drop in existing home sales in May compared to the previous month.
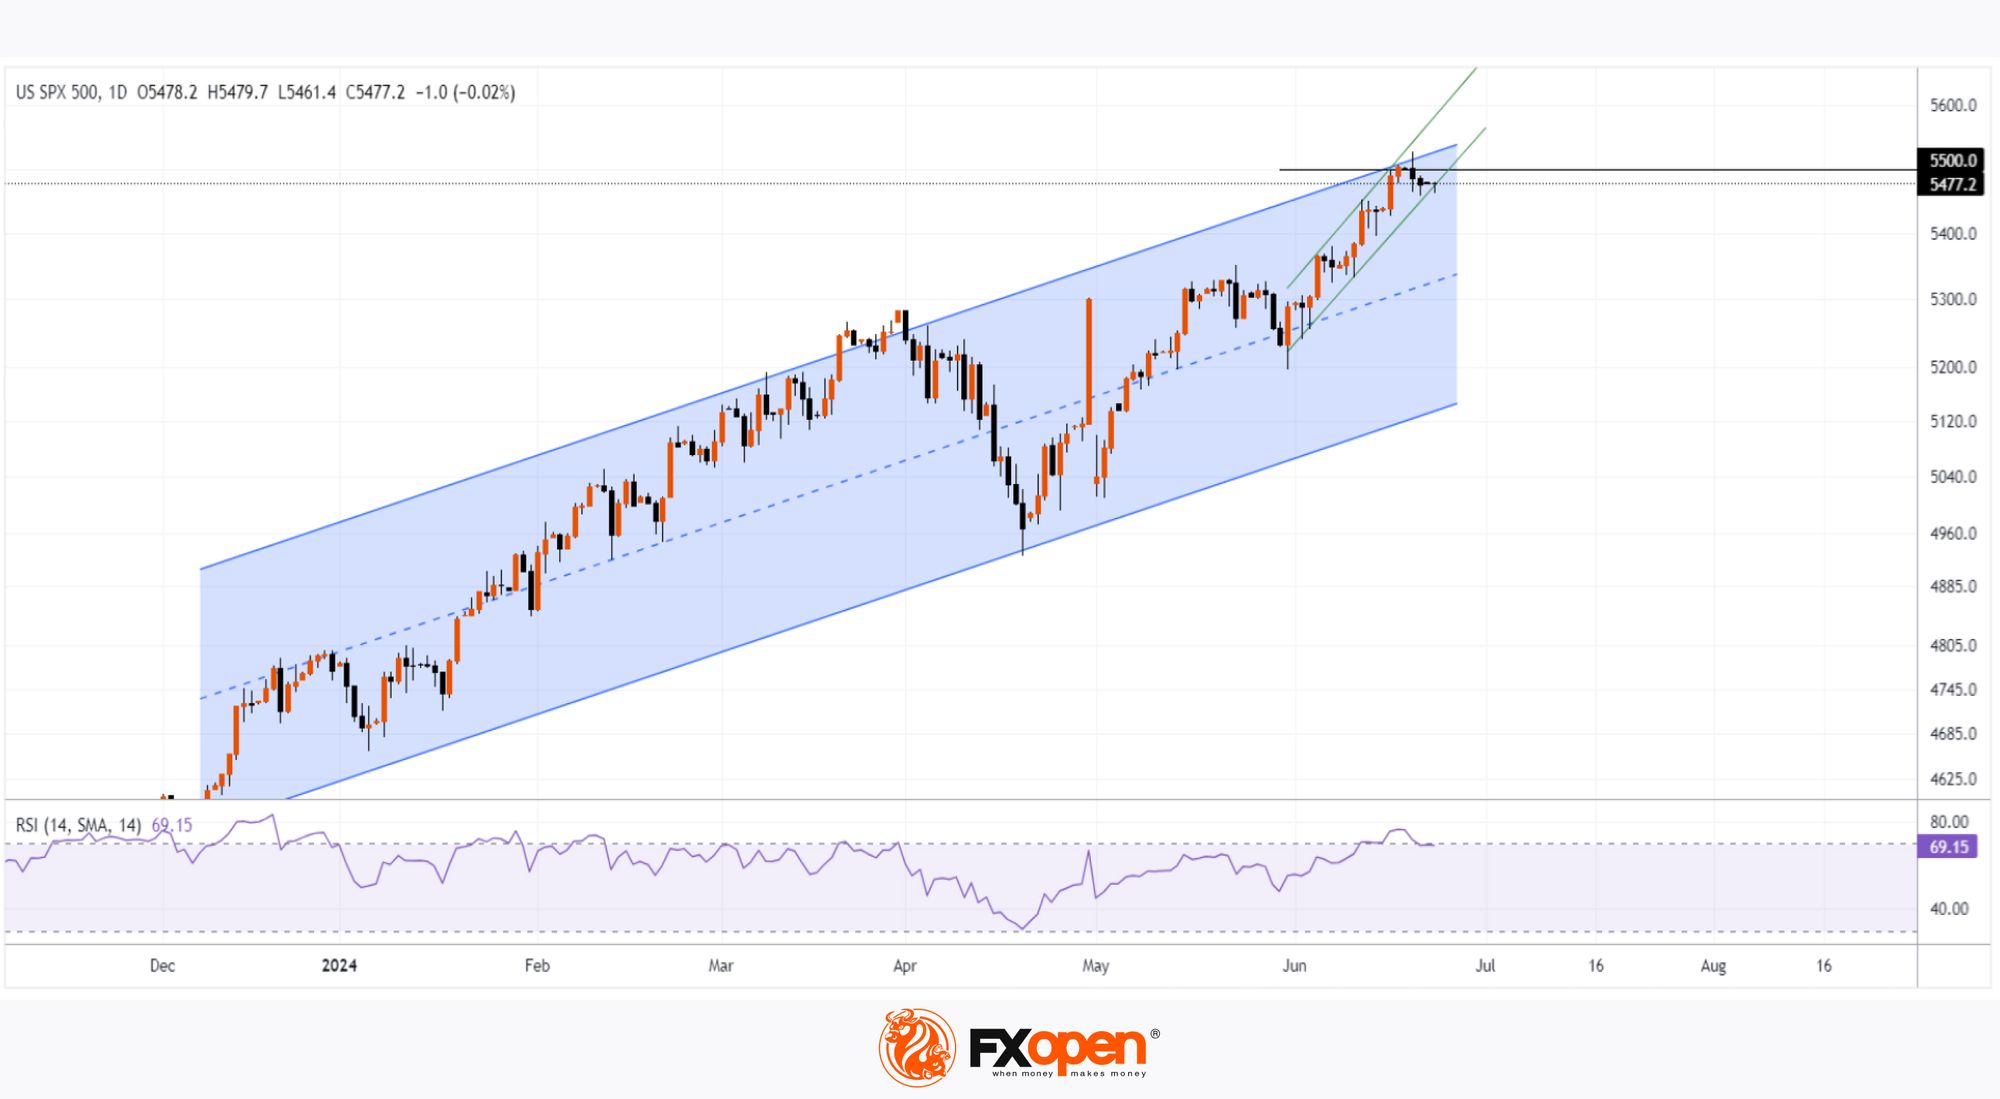
Technical analysis of the daily chart of the S&P 500 Index (US SPX 500 mini on FXOpen) shows that:
→ the price is in a large upward trend that began last year;
→ the price is near the upper boundary of this channel;
→ the price has fallen below the psychological level of 5500;
→ the price is still in the June upward trend (shown in green);
→ the RSI indicator points to some market overbought conditions.
Given these facts, it is reasonable to assume that the S&P 500 Index (US SPX 500 mini on FXOpen) is in a vulnerable position for a pullback from the resistance block formed by the psychological level of 5500 and the upper boundary of the channel. The June upward trend may be broken.
Moreover, a possible correction might take on a threatening character if Friday’s news shows that US inflation is not slowing down – which would strengthen market participants’ belief that the period of high rates will last longer than expected.
Trade global index CFDs with zero commission and tight spreads (additional fees may apply). Open your FXOpen account now or learn more about trading index CFDs with FXOpen.
This article represents the opinion of the Companies operating under the FXOpen brand only. It is not to be construed as an offer, solicitation, or recommendation with respect to products and services provided by the Companies operating under the FXOpen brand, nor is it to be considered financial advice.
Stay ahead of the market!
Subscribe now to our mailing list and receive the latest market news and insights delivered directly to your inbox.


Latest articles

AI Valuations Are Back in the Spotlight
Artificial intelligence remains the dominant investment theme of 2026, but investors are increasingly questioning whether AI stock valuations are keeping pace with reality.
💰 Big Tech continues to invest at an unprecedented scale, with hyperscaler AI spending projected to exceed $800

AUD/CAD: Months of Indecision — Is a Breakout Finally Coming?
The Australian dollar has clawed back most of its end-of-June losses, when it touched three-month lows against the greenback amid escalating Middle East tensions. Since then, sentiment has improved: the RBA's Assistant Governor Sarah Hunter signalled the board stands ready

USD/JPY: Battling at the Top of the Triangle
On 3 July, Japan's Finance Minister, Satsuki Katayama, stated that the Ministry of Finance remains in close contact with US authorities regarding developments in USD/JPY as the yen traded near its weakest level in almost 40 years. Similar verbal