


FXOpen

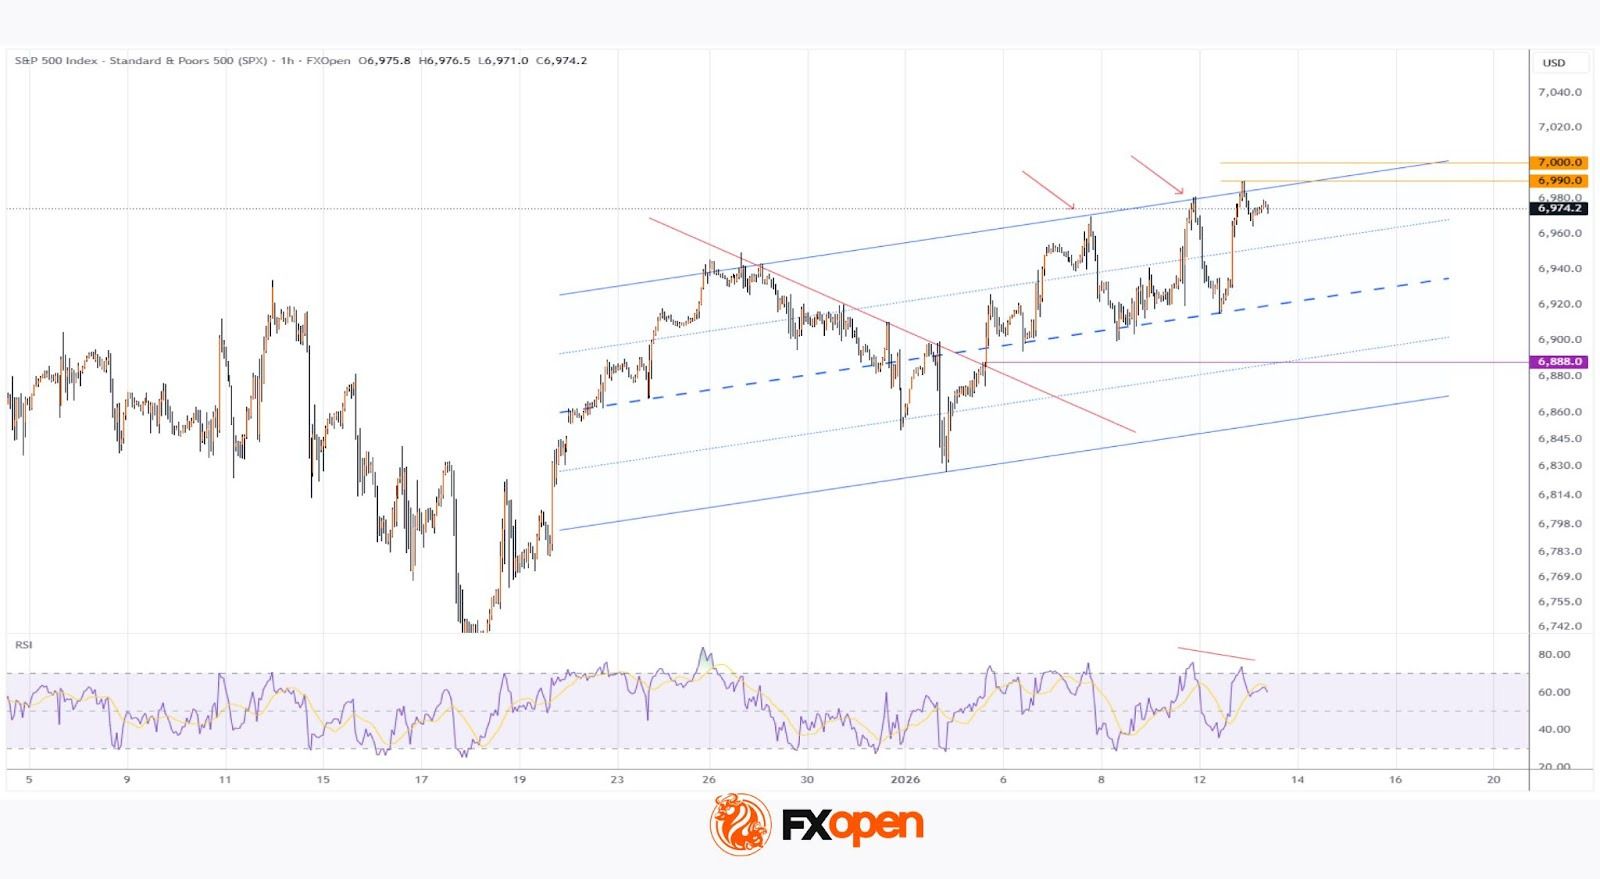
As the S&P 500 chart shows (US SPX 500 mini on FXOpen), the index touched 6,990 yesterday, marking an all-time high for the first time. The psychological 7,000 level is now within close reach. Optimism may be driven by the start of the earnings season, which could confirm continued growth in corporate profits.
But is the outlook entirely positive?
From a fundamental perspective, several factors could raise concerns:
→ News surrounding a criminal case involving Jerome Powell. This may be perceived as pressure on the Fed Chair and a threat to the central bank’s independence, potentially undermining the investment climate.
→ The upcoming release of CPI data (scheduled for today at 16:30 GMT+3). A scenario in which the figures point to rising inflation cannot be ruled out, which could trigger a sharp sell-off in equity markets.
→ Risks of the US becoming involved in new military conflicts.
From a technical standpoint, bearish signals are also emerging on the chart.
Technical analysis of the S&P 500
Price action in the S&P 500 (US SPX 500 mini on FXOpen) is forming an ascending channel. However, it is worth noting the market’s reaction after reaching the upper boundary of this channel: on two occasions (as indicated by the arrows), the index has seen sharp pullbacks towards the median line. This behaviour suggests aggressive selling pressure. At the same time, the RSI indicator is showing bearish divergence.
The channel median has so far acted as solid support. Nevertheless, with bears successfully defending the psychological 7,000 level and the fundamental backdrop capable of delivering negative surprises, sharper declines in the S&P 500 cannot be ruled out.
In such a scenario, potential downside targets may include:
→ the 6,888 support level, where the red trendline was broken;
→ the lower boundary of the ascending channel.
Trade global index CFDs with zero commission and tight spreads (additional fees may apply). Open your FXOpen account now or learn more about trading index CFDs with FXOpen.
This article represents the opinion of the Companies operating under the FXOpen brand only. It is not to be construed as an offer, solicitation, or recommendation with respect to products and services provided by the Companies operating under the FXOpen brand, nor is it to be considered financial advice.
Stay ahead of the market!
Subscribe now to our mailing list and receive the latest market news and insights delivered directly to your inbox.


Latest articles

GBP/JPY Falls to a Year-to-Date Low
As the GBP/JPY chart shows, the pound has dropped below the 12 February low against the Japanese yen, marking its weakest level since the beginning of 2026. The pair last traded beneath the 207.500 mark in mid-December 2025.

Gold Price Falls to a 10-Day Low
As today’s XAU/USD chart shows, the price of gold has dropped below the lows of 12 February, marking its weakest level in ten days. According to media reports, several factors are weighing on bullion:
→ Easing geopolitical tensions. Safe-haven
