


S&P 500 Hits Record High Ahead of CPI Report
FXOpen

Today at 15:30 GMT+3, the Consumer Price Index (CPI) report will be released.
In anticipation of the figures, traders remain optimistic – the S&P 500 index (US SPX 500 mini on FXOpen) reached a new all-time high yesterday, climbing above 6,560 points.
The bullish sentiment is driven by:
→ Expectations of an interest rate cut in September, which is believed to provide a positive boost to the US economy (and increase corporate profits).
→ A sharp rally in Oracle (ORCL) shares. The company announced it had signed four multibillion-dollar contracts with three different clients.
Technical Analysis of the S&P 500
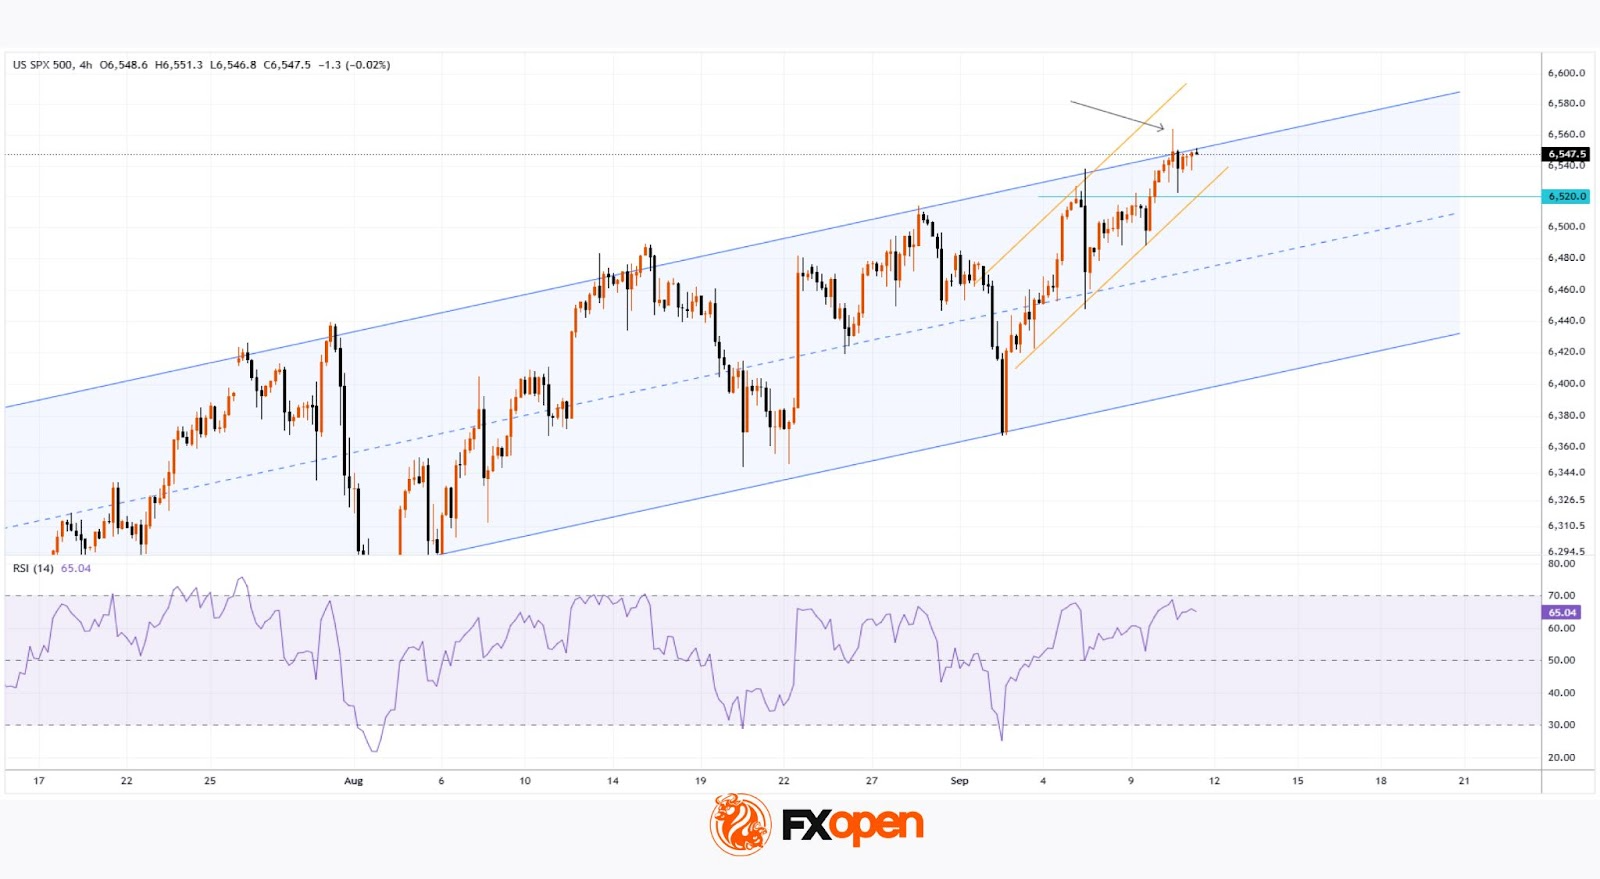
On the 4-hour chart of the S&P 500 index (US SPX 500 mini on FXOpen), the price continues to move within an ascending channel, shown in blue.
From a bearish perspective:
→ the price is near the upper boundary of the channel, which has acted as resistance for several weeks;
→ the RSI indicator is close to the overbought zone, which may discourage buyers from entering at higher prices;
→ yesterday’s candle had a long upper shadow (marked with an arrow), indicating increased selling pressure.
From a bullish perspective:
→ the local level of 6,520, after being broken, has switched from resistance to support;
→ in September, the price has followed a steep upward trajectory (marked with orange lines), with the lower line showing signs of support.
Taking this into account, we could assume that the market is in a short-term state of balance while awaiting the release of inflation data – arguably the key event of the week in the economic calendar.
Favourable figures could encourage the bulls to attempt a breakout above the upper boundary of the channel, lifting the S&P 500 to a new all-time high. Be prepared for spikes in volatility.
Trade global index CFDs with zero commission and tight spreads (additional fees may apply). Open your FXOpen account now or learn more about trading index CFDs with FXOpen.
This article represents the opinion of the Companies operating under the FXOpen brand only. It is not to be construed as an offer, solicitation, or recommendation with respect to products and services provided by the Companies operating under the FXOpen brand, nor is it to be considered financial advice.
Stay ahead of the market!
Subscribe now to our mailing list and receive the latest market news and insights delivered directly to your inbox.


Latest articles

EUR/USD: All Eyes on the Fed as the Range Reaches Its Breaking Point
The dollar's next move hinges on tonight's Fed decision, and this time markets genuinely don't know what to expect. While economists still lean toward a hold—with CME FedWatch odds sitting near 68.5% for no change—Kevin Warsh's hawkish

USD/JPY and USD/CAD Test Resistance Ahead of Fresh Fed Signals
The US dollar continues to hold the upper hand against most major currencies ahead of the outcome of the latest Federal Reserve meeting. While the base-case scenario remains for interest rates to stay unchanged, markets are also pricing in the

Amazon Earnings: Does the Chart Already Know Something the Numbers Don't?
All eyes are on July 30, when Amazon reports Q2 2026 earnings, with Wall Street increasingly convinced the bar has been set too low. Consensus sees EPS near $1.82-$2.26 on roughly $197 billion in revenue, but the