


S&P 500 Index: Chart Analysis Ahead of Fed News
FXOpen

On 2 December, we noted that the final month of the year is traditionally favourable for the S&P 500 index (US SPX 500 mini on FXOpen), as:
→ since around the 1950s, December has been positive in more than 70% of cases;
→ the average monthly gain is approximately +1.0%.
Today, with traders worldwide focused on the Federal Reserve’s interest rate decision and Chair Powell’s subsequent press conference, there is reason to highlight another statistic. According to media reports, in 20 out of 20 instances when equity markets were near record highs and the Fed cut rates, the S&P 500 rose over the following 12 months.
Given the current backdrop — proximity to all-time highs and expectations of rate cuts — it is possible that this could become the 21st such case.
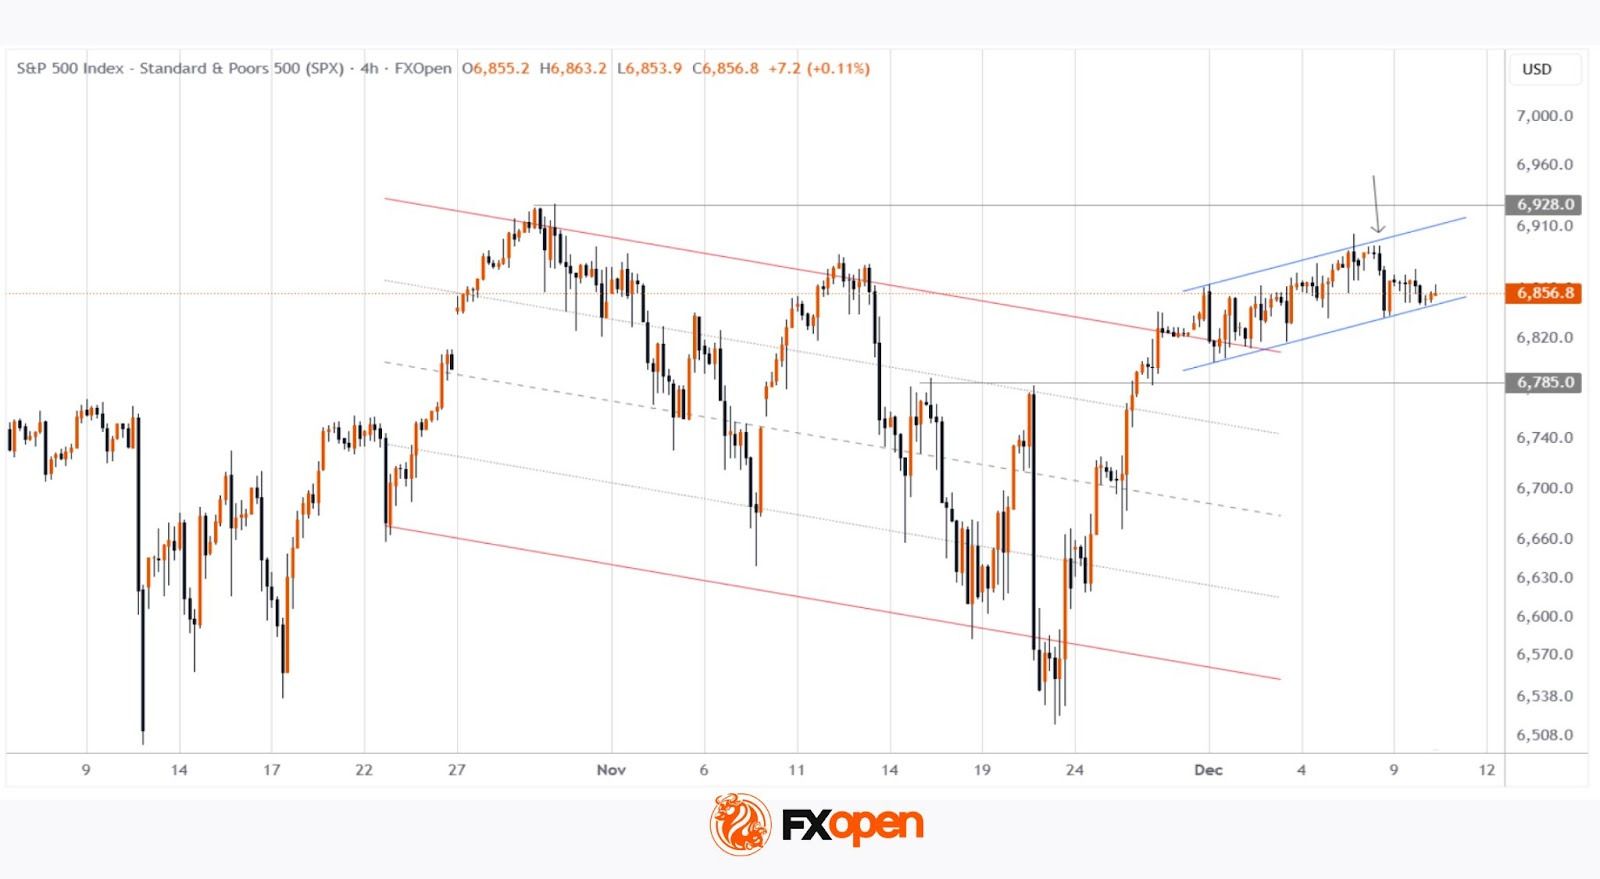
An analysis of price action on the 4-hour chart of the S&P 500 (US SPX 500 mini on FXOpen) suggests that the stock market is reflecting nervous anticipation of the news, as the index is trading at roughly the same levels as at the start of December.
Technical Analysis of the S&P 500 Chart
From the demand side:
→ the price has managed to hold firmly above the 6785 level (which may act as support going forward) and has broken above a previously formed descending channel (shown in red);
→ an ascending channel formed in early December, which can be interpreted as cautious optimism ahead of the news.
From the supply side:
→ the late-October record high may act as psychological resistance;
→ yesterday’s decline (indicated by the arrow) suggests that bears are ready to act more aggressively if given a catalyst.
Overall, taking the above into account, it is reasonable to suggest that the S&P 500 market (US SPX 500 mini on FXOpen) is in a “calm before the storm” phase. Be prepared for volatility spikes later today, starting from 22:00 GMT+3.
Trade global index CFDs with zero commission and tight spreads (additional fees may apply). Open your FXOpen account now or learn more about trading index CFDs with FXOpen.
This article represents the opinion of the Companies operating under the FXOpen brand only. It is not to be construed as an offer, solicitation, or recommendation with respect to products and services provided by the Companies operating under the FXOpen brand, nor is it to be considered financial advice.
Stay ahead of the market!
Subscribe now to our mailing list and receive the latest market news and insights delivered directly to your inbox.


Latest articles

EUR/USD: All Eyes on the Fed as the Range Reaches Its Breaking Point
The dollar's next move hinges on tonight's Fed decision, and this time markets genuinely don't know what to expect. While economists still lean toward a hold—with CME FedWatch odds sitting near 68.5% for no change—Kevin Warsh's hawkish

USD/JPY and USD/CAD Test Resistance Ahead of Fresh Fed Signals
The US dollar continues to hold the upper hand against most major currencies ahead of the outcome of the latest Federal Reserve meeting. While the base-case scenario remains for interest rates to stay unchanged, markets are also pricing in the

Amazon Earnings: Does the Chart Already Know Something the Numbers Don't?
All eyes are on July 30, when Amazon reports Q2 2026 earnings, with Wall Street increasingly convinced the bar has been set too low. Consensus sees EPS near $1.82-$2.26 on roughly $197 billion in revenue, but the