


FXOpen

Yesterday, disappointing news about the US economy was released. According to ForexFactory:
→ The ISM Manufacturing PMI fell from 48.5 to 46.8 (analysts expected a rise to 48.8), indicating a decline in industrial production.
→ The number of unemployment benefit claims reached 249,000 – the highest in 12 months.
As a result, US stock indices declined, with bearish sentiment further driven by weak Q2 reports from several companies:
→ Intel decided to halt dividend payments (INTC shares plummeted by 19%).
→ Amazon reported a revenue decline (AMZN shares dropped by 6%).
The outperformance of sectors such as consumer staples, healthcare, and utilities compared to technology stocks suggests that investors fear a recession and are rotating into more stable assets.
Meanwhile, the daily S&P 500 chart (US SPX 500 mini on FXOpen) indicates a vulnerable position – since mid-April, the price has been moving within an upward channel (shown in blue), but today it is near the lower boundary, creating a risk of a bearish breakout.
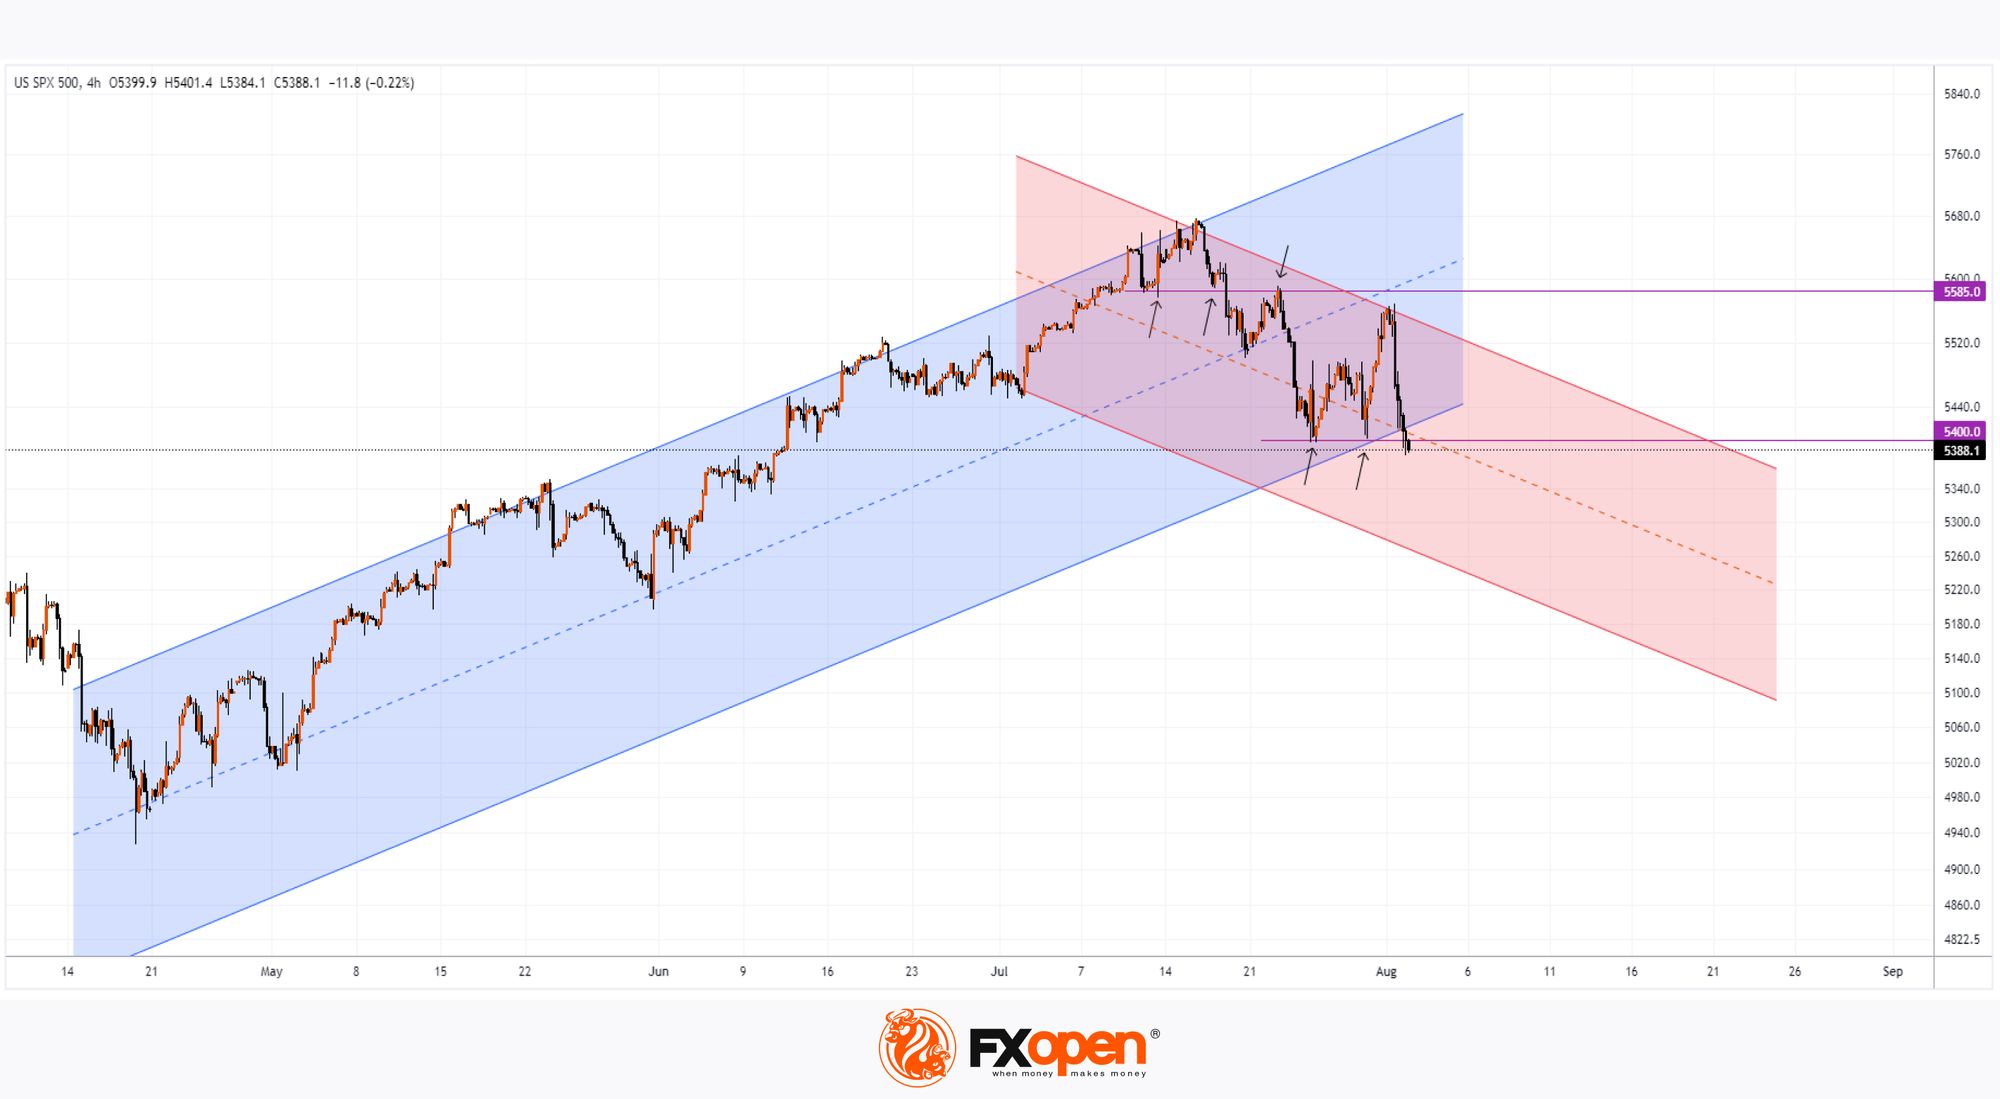
Technical analysis of the S&P 500 (US SPX 500 mini on FXOpen):
→ Having twice acted as support, the 5585 level has become resistance (as indicated by the arrows). A similar transformation may occur with the psychological level of 5400.
→ The lower highs in July provide grounds to define the contours of a downward channel, which will gain more relevance if the bears manage to push the price through the lower blue boundary – intensifying recession talks.
Trade global index CFDs with zero commission and tight spreads (additional fees may apply). Open your FXOpen account now or learn more about trading index CFDs with FXOpen.
This article represents the opinion of the Companies operating under the FXOpen brand only. It is not to be construed as an offer, solicitation, or recommendation with respect to products and services provided by the Companies operating under the FXOpen brand, nor is it to be considered financial advice.
Stay ahead of the market!
Subscribe now to our mailing list and receive the latest market news and insights delivered directly to your inbox.


Latest articles

European Currencies Decline: Pound Hits New Lows, Euro Under Pressure
European currencies continue to weaken against the US dollar amid rising geopolitical tensions and increased demand for safe-haven and liquid assets. Market participants are reducing exposure to riskier instruments, putting pressure on both the euro and the pound. Additional support

Market Analysis: GBP/USD Dips Further As EUR/GBP Regains Traction
GBP/USD failed to climb above 1.3500 and corrected some gains. EUR/GBP started a decent increase and might aim for more gains above 0.8700.
Important Takeaways for GBP/USD and EUR/GBP Analysis Today
· The British Pound
