


FXOpen

As shown by the S&P 500 chart (US SPX 500 mini on FXOpen), the leading US stock index set its 45th record of the year, closing above 5800 on Friday. This marks the fifth consecutive week of growth, with the index up more than 22% since the start of the year.
According to Reuters, the bullish market sentiment is driven by the start of Q3 earnings season, with companies possibly issuing bolder forecasts due to the beginning of the Fed’s rate-cutting cycle.
What are the prospects for the index until the end of 2024?
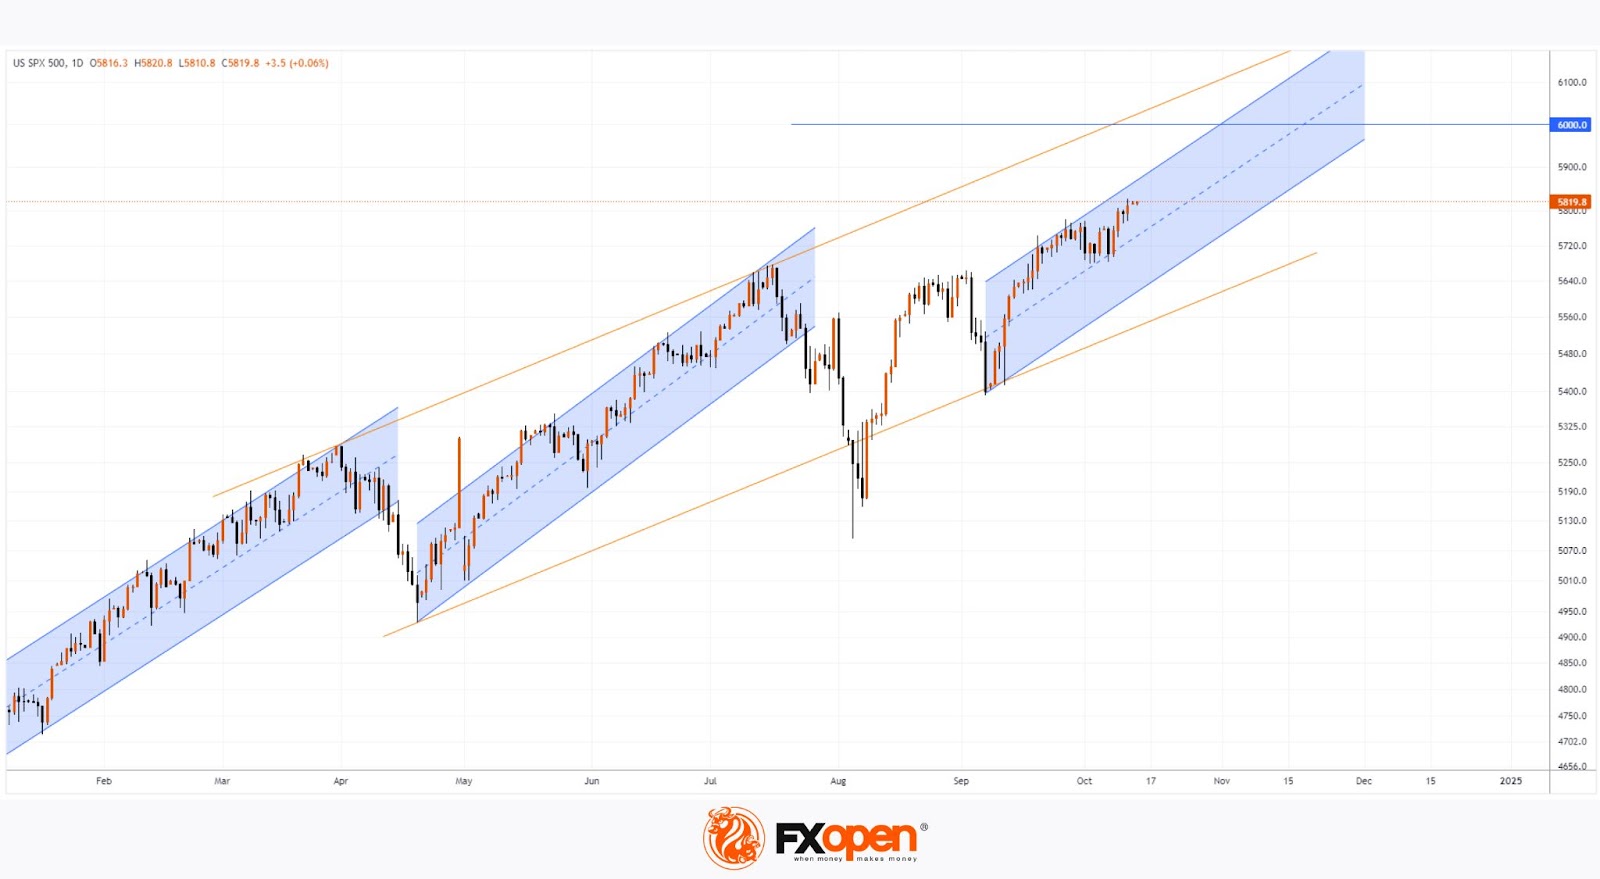
A technical analysis of the daily S&P 500 chart (US SPX 500 mini on FXOpen) shows:
In 2024, price action has been contained within three relatively narrow ascending channels (shown in blue), where:
→ The first two channels remained valid for at least 80 candles, and the third has now reached 30 candles;
→ The channels have similar slopes and widths;
→ Drawing lines through the high of Channel 1, the high and low of Channel 2, and the low of Channel 3 forms a larger channel (shown in orange).
If the bullish sentiment persists, the S&P 500 (US SPX 500 mini on FXOpen) may continue to rise within the third blue channel towards the upper orange line.
However, several factors could significantly impact the market before the year's end: → Labour market data, as well as Fed decisions and comments;
→ US presidential elections and budget approval;
→ Company earnings and forecasts that fall well below market expectations.
Goldman Sachs analysts predict that the S&P 500 could reach 6,000 by the end of 2024.
Trade global index CFDs with zero commission and tight spreads (additional fees may apply). Open your FXOpen account now or learn more about trading index CFDs with FXOpen.
This article represents the opinion of the Companies operating under the FXOpen brand only. It is not to be construed as an offer, solicitation, or recommendation with respect to products and services provided by the Companies operating under the FXOpen brand, nor is it to be considered financial advice.
Stay ahead of the market!
Subscribe now to our mailing list and receive the latest market news and insights delivered directly to your inbox.


Latest articles

Market Analysis: GBP/USD Dips Further As EUR/GBP Regains Traction
GBP/USD failed to climb above 1.3500 and corrected some gains. EUR/GBP started a decent increase and might aim for more gains above 0.8700.
Important Takeaways for GBP/USD and EUR/GBP Analysis Today
· The British Pound


Market Insights with Gary Thomson: Oil, US Retail Sales & NFP in Focus
In this video, we’ll explore the key economic events and market trends, shaping the financial landscape. Get ready for insights into financial markets to help you navigate the week ahead. Let’s dive in!
In this episode of Market