


FXOpen

Historically, September has been the worst month for the S&P 500 (US SPX 500 mini on FXOpen), and the start of the month reflected this trend, with the index dropping around 4.5% from 1 to 6 September, indicating bearish sentiment.
However, yesterday's event — the release of the Consumer Price Index (CPI) — may have marked a turning point.
According to Reuters, US inflation data showed that the core CPI rose by 0.28% in August, slightly above the forecast of 0.2%. This led market participants to believe that the Federal Reserve might agree to a 25-basis point rate cut next Wednesday.
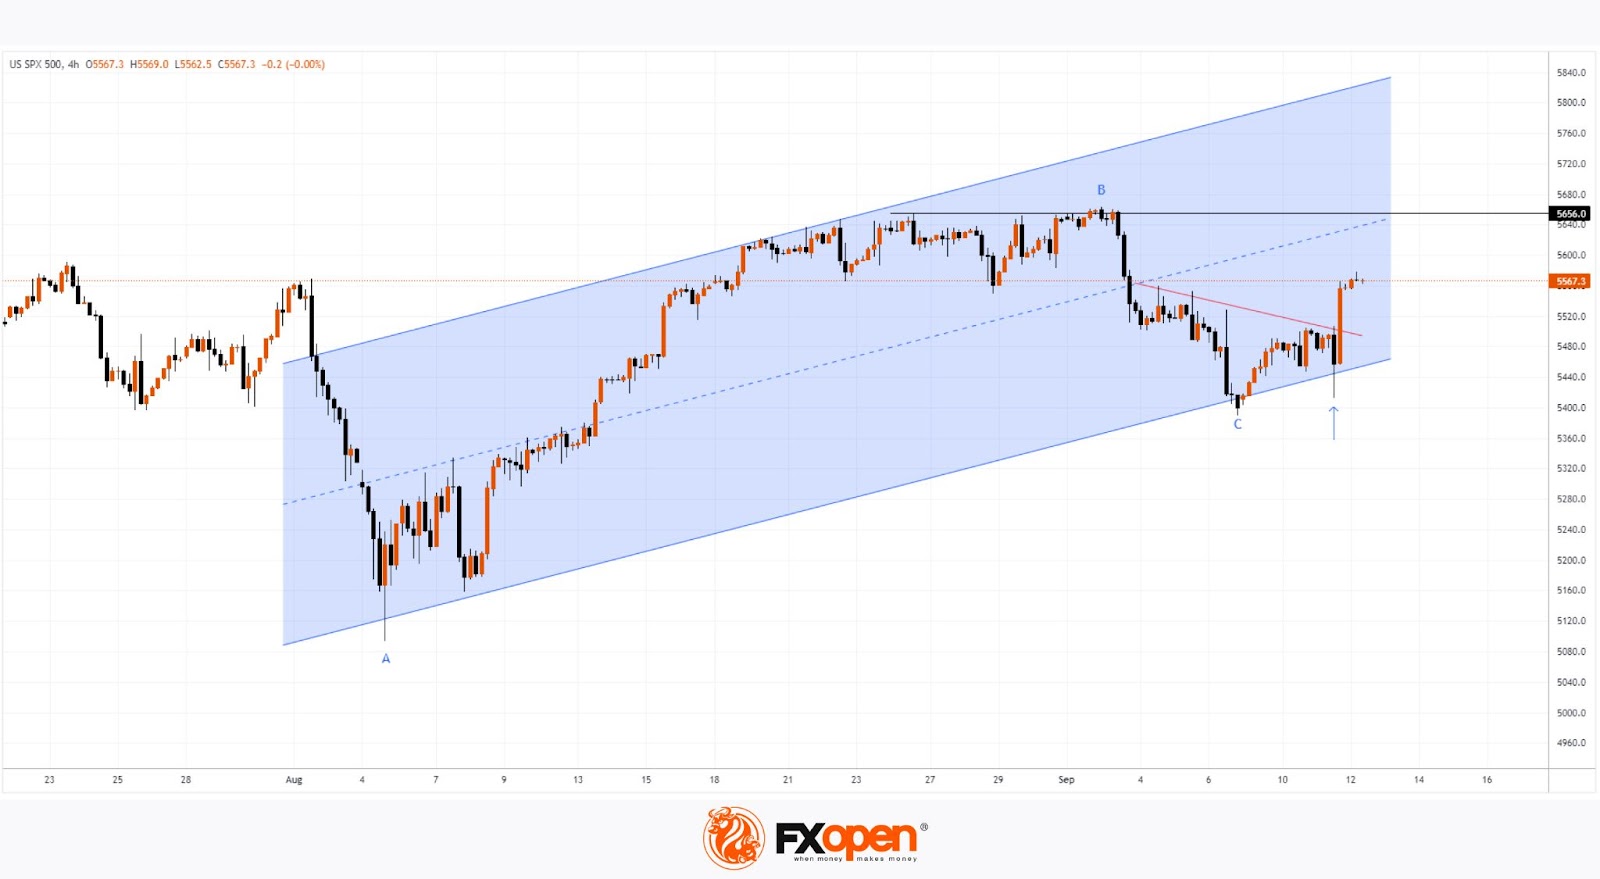
Technical analysis of the S&P 500 (US SPX 500 mini on FXOpen) chart indicates:
→ The price is moving within an ascending channel (shown in blue), having rebounded from its lower boundary yesterday and breaking the local descending trend line (shown in red).
→ The movement from B to C is approximately 50% of the A to B impulse, a bullish signal that suggests the "normal" correction may be complete, indicating a potential rally from the 5 August low.
→ Yesterday's price drop was a false move (indicated by the arrow), creating a bear trap.
As of mid-month, the outlook appears positive. It’s possible that the S&P 500 (US SPX 500 mini on FXOpen) could finish the month in the green, though the Fed's long-anticipated rate cut decision, expected next week, will play a crucial role in this outcome.
Trade global index CFDs with zero commission and tight spreads (additional fees may apply). Open your FXOpen account now or learn more about trading index CFDs with FXOpen.
This article represents the opinion of the Companies operating under the FXOpen brand only. It is not to be construed as an offer, solicitation, or recommendation with respect to products and services provided by the Companies operating under the FXOpen brand, nor is it to be considered financial advice.
Stay ahead of the market!
Subscribe now to our mailing list and receive the latest market news and insights delivered directly to your inbox.


Latest articles

Consolidation Ahead of NFP: Commodity Currencies Search for Direction
Commodity-linked currencies have entered a consolidation phase following recent directional moves, as market participants adopt a wait-and-see approach ahead of key US labour market data. Current price action reflects a balance between ongoing demand for the US dollar and attempts

The Real Driver Behind the Dollar Rally: Market Insights with Gary Thomson
The US dollar has been firm, but the drivers behind the move may be more complex than they first appear.
While geopolitical tension and shifts in risk sentiment play a role, current price behaviour seems increasingly influenced by inflation expectations

EUR/USD and USD/CHF Pull Back: Market Reacts to Fundamentals
European currencies have shown a recovery in recent trading sessions after their recent decline, displaying early signs of a reversal. The US dollar is weakening amid expectations surrounding upcoming US macroeconomic data, while market participants are reassessing their short-term positions